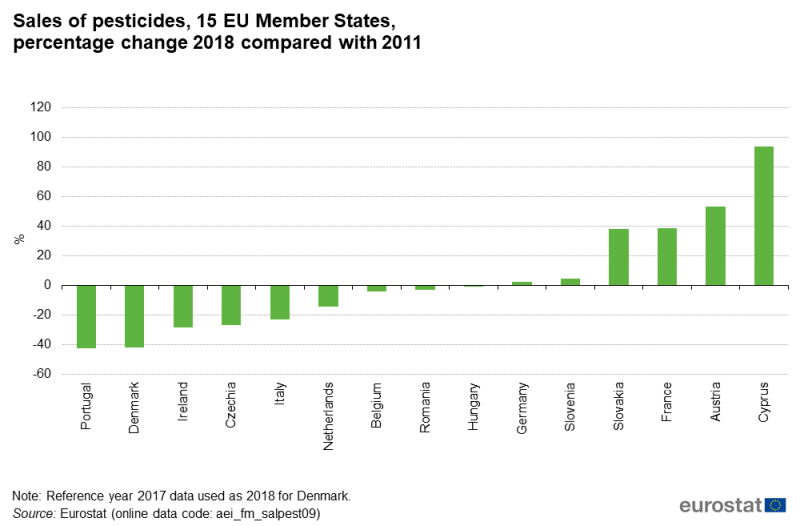
File:Figure 2 Sales of pesticides, 15 EU Member States, percentage change 2018 compared with 2011.png

Size of this preview: 800 × 526 pixels. Other resolutions: 320 × 210 pixels | 1,000 × 657 pixels.
Original file (1,000 × 657 pixels, file size: 44 KB, MIME type: image/png)
File usage
There are no pages that use this file.