_index_(base%3D2015).png)
 index (base=2015).png&body=Statistics Explained - Figure 1 Evolution of EU-28's value of sold industrial production, 2008 - 2018 (2015=100) index (base=2015).png %0A https%3A%2F%2Fec.europa.eu%2Feurostat%2Fstatistics-explained%2Findex.php%3Ftitle%3DFile%3AFigure_1_Evolution_of_EU-28%2527s_value_of_sold_industrial_production%2C_2008_-_2018_%282015%253D100%29_index_%28base%253D2015%29.png)
File:Figure 1 Evolution of EU-28's value of sold industrial production, 2008 - 2018 (2015=100) index (base=2015).png
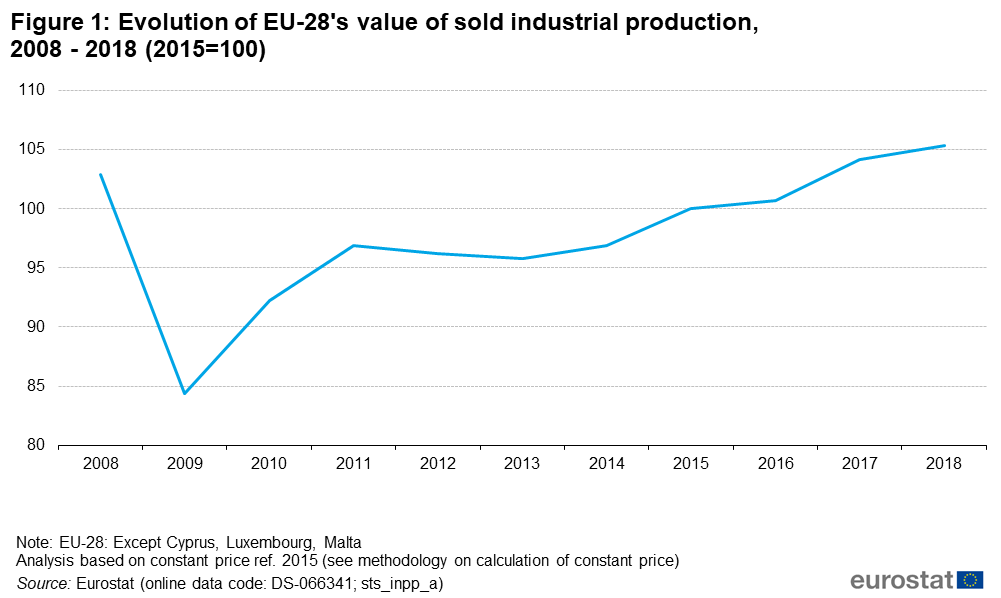
Size of this preview: 800 × 478 pixels. Other resolutions: 320 × 191 pixels | 1,001 × 598 pixels.
Original file (1,001 × 598 pixels, file size: 41 KB, MIME type: image/png)
There is currently no text in this page. You can search for this page title in other pages, search the related logs, or create this page.
_index_(base%3D2015).png)
File usage
There are no pages that use this file.
_index_(base%3D2015).png&oldid=463961)
_index_(base%3D2015).png)
_index_(base%3D2015).png&action=edit&redlink=1)
_index_(base%3D2015).png&action=history)