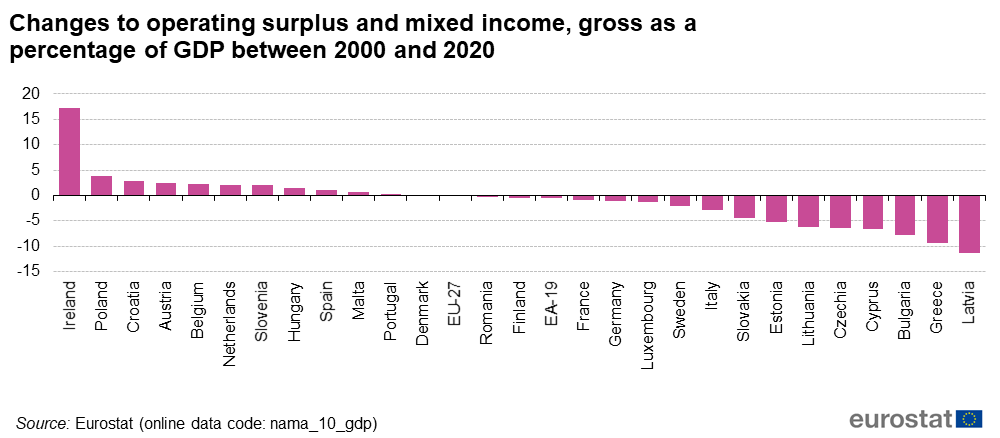
File:Fig6-Changes to operating surplus and mixed income, gross as a percentage of GDP between 2000 and 2020.png
Size of this preview: 800 × 350 pixels. Other resolutions: 320 × 140 pixels | 1,000 × 438 pixels.
Original file (1,000 × 438 pixels, file size: 42 KB, MIME type: image/png)
File usage
The following file is a duplicate of this file (more details):
There are no pages that use this file.