.png)
.png&body=Statistics Explained - FIGURE4 Sectoral structure of output for the year 2015 in the EU and the euro area (in % of output).png %0A https%3A%2F%2Fec.europa.eu%2Feurostat%2Fstatistics-explained%2Findex.php%3Ftitle%3DFile%3AFIGURE4_Sectoral_structure_of_output_for_the_year_2015_in_the_EU_and_the_euro_area_%28in_%2525_of_output%29.png)
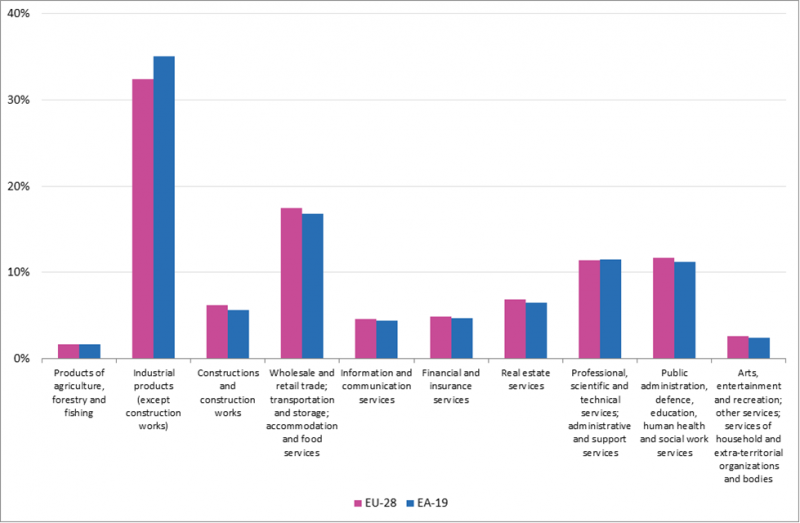
File:FIGURE4 Sectoral structure of output for the year 2015 in the EU and the euro area (in % of output).png

Size of this preview: 800 × 523 pixels. Other resolutions: 320 × 209 pixels | 979 × 640 pixels.
Original file (979 × 640 pixels, file size: 59 KB, MIME type: image/png)
File usage
There are no pages that use this file.
.png&oldid=329392)
.png)
.png&action=edit&redlink=1)
.png&action=history)