.png)
.png&body=Statistics Explained - Economic activities with the largest increase decrease in the number of employed people between Q1 2021 and Q1 2022 in the EU (in % change, age group 15-64).png %0A https%3A%2F%2Fec.europa.eu%2Feurostat%2Fstatistics-explained%2Findex.php%3Ftitle%3DFile%3AEconomic_activities_with_the_largest_increase_decrease_in_the_number_of_employed_people_between_Q1_2021_and_Q1_2022_in_the_EU_%28in_%2525_change%2C_age_group_15-64%29.png)
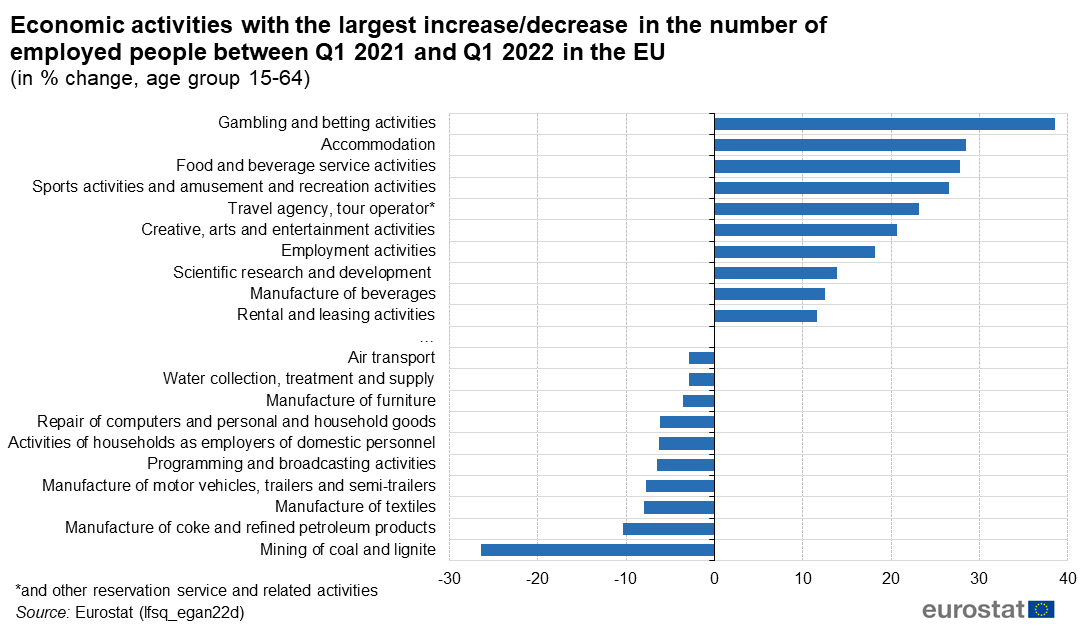
File:Economic activities with the largest increase decrease in the number of employed people between Q1 2021 and Q1 2022 in the EU (in % change, age group 15-64).png
Size of this preview: 800 × 466 pixels. Other resolutions: 320 × 186 pixels | 1,086 × 632 pixels.
Original file (1,086 × 632 pixels, file size: 69 KB, MIME type: image/png)
File usage
There are no pages that use this file.
.png&oldid=571273)
.png)
.png&action=edit&redlink=1)
.png&action=history)