.png)
.png&body=Statistics Explained - Distribution of men and women by ILO status, EU, in 2006 and in 2020 (age group 20-54 and 55-64, in % of the total population).png %0A https%3A%2F%2Fec.europa.eu%2Feurostat%2Fstatistics-explained%2Findex.php%3Ftitle%3DFile%3ADistribution_of_men_and_women_by_ILO_status%2C_EU%2C_in_2006_and_in_2020_%28age_group_20-54_and_55-64%2C_in_%2525_of_the_total_population%29.png)
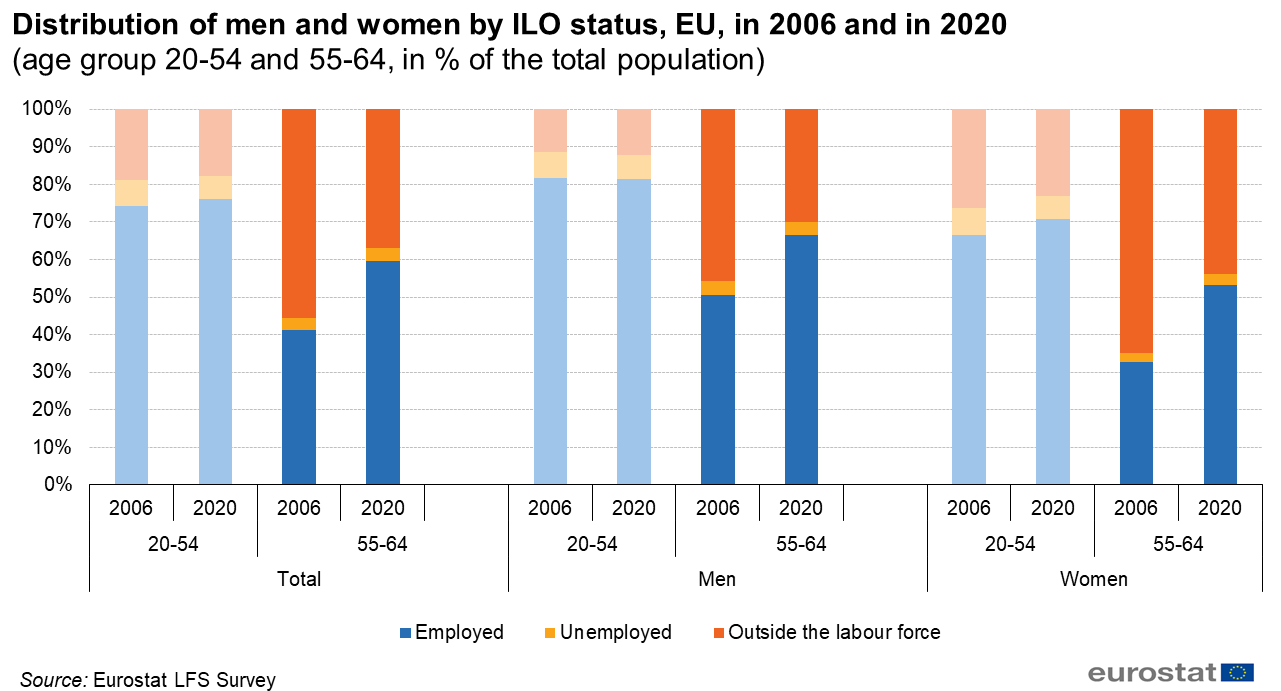
File:Distribution of men and women by ILO status, EU, in 2006 and in 2020 (age group 20-54 and 55-64, in % of the total population).png
Size of this preview: 800 × 432 pixels. Other resolutions: 320 × 173 pixels | 1,281 × 691 pixels.
Original file (1,281 × 691 pixels, file size: 87 KB, MIME type: image/png)
File usage
There are no pages that use this file.
.png&oldid=534932)
.png)
.png&action=edit&redlink=1)
.png&action=history)