_PF15.png)
 PF15.png&body=Statistics Explained - Distribution of dwellings by period of construction, national averages and NUTS level 3 capital city regions, 2011 (% of all dwellings) PF15.png %0A https%3A%2F%2Fec.europa.eu%2Feurostat%2Fstatistics-explained%2Findex.php%3Ftitle%3DFile%3ADistribution_of_dwellings_by_period_of_construction%2C_national_averages_and_NUTS_level_3_capital_city_regions%2C_2011_%28%2525_of_all_dwellings%29_PF15.png)
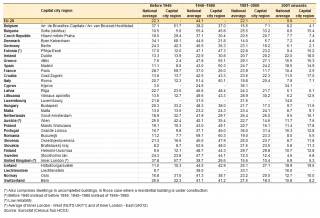
File:Distribution of dwellings by period of construction, national averages and NUTS level 3 capital city regions, 2011 (% of all dwellings) PF15.png

Size of this preview: 800 × 546 pixels. Other resolutions: 320 × 218 pixels | 1,024 × 699 pixels.
Original file (1,024 × 699 pixels, file size: 64 KB, MIME type: image/png)
File usage
There are no pages that use this file.
_PF15.png&oldid=254136)
_PF15.png)
_PF15.png&action=edit&redlink=1)
_PF15.png&action=history)