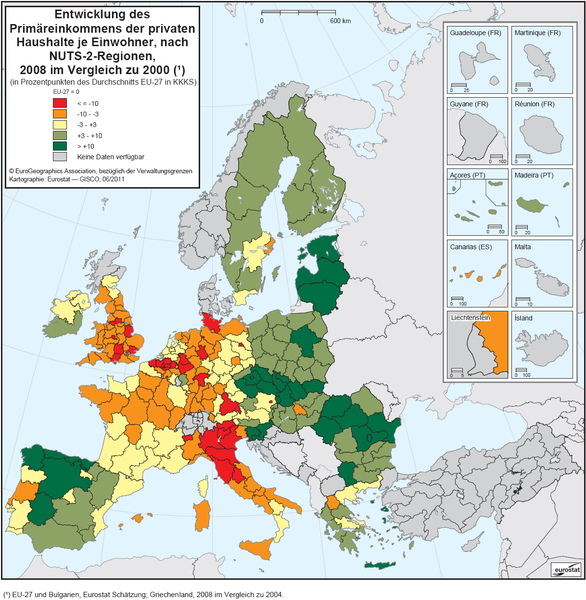
File:Development of primary income of private households per inhabitant, by NUTS 2 regions, 2008 as compared with 2000-de.PNG

Size of this preview: 586 × 600 pixels. Other resolutions: 234 × 240 pixels | 1,218 × 1,247 pixels.
Original file (1,218 × 1,247 pixels, file size: 346 KB, MIME type: image/png)
Karte 3: Entwicklung des Primäreinkommens der privaten Haushalte je Einwohner, nach NUTS-2-Regionen, 2008 im Vergleich zu 2000 (¹) (in Prozentpunkten des Durchschnitts EU-27 in KKKS) - Quelle: Eurostat (online Datenkode: nama_r_ehh2inc)
File usage
The following page uses this file: