-Figure3.png)
-Figure3.png&body=Statistics Explained - DMC and GDP - average annual change rates in EU-28 and countries between 2000 and 2016 (%)-Figure3.png %0A https%3A%2F%2Fec.europa.eu%2Feurostat%2Fstatistics-explained%2Findex.php%3Ftitle%3DFile%3ADMC_and_GDP_-_average_annual_change_rates_in_EU-28_and_countries_between_2000_and_2016_%28%2525%29-Figure3.png)
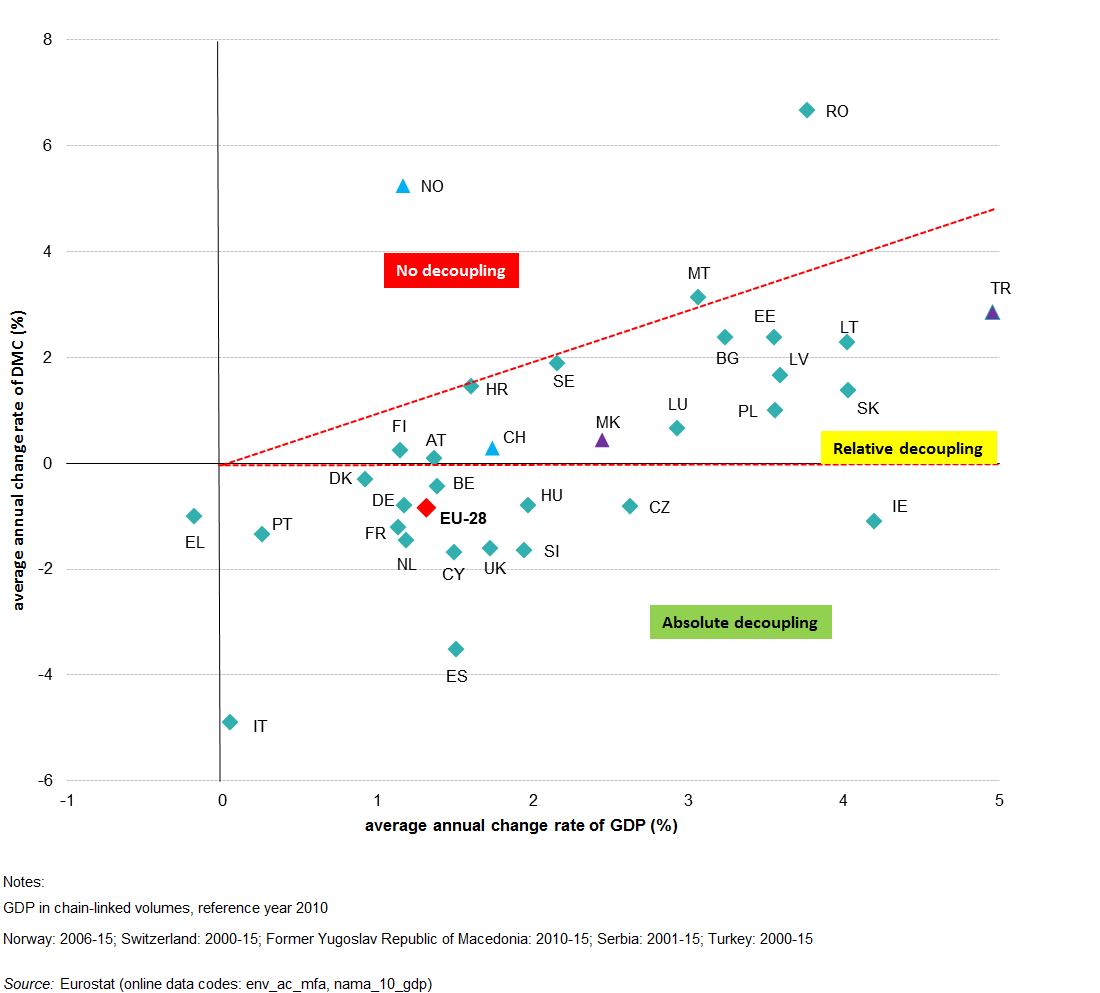
File:DMC and GDP - average annual change rates in EU-28 and countries between 2000 and 2016 (%)-Figure3.png
Size of this preview: 664 × 599 pixels. Other resolutions: 266 × 240 pixels | 1,100 × 993 pixels.
Original file (1,100 × 993 pixels, file size: 35 KB, MIME type: image/png)
File usage
There are no pages that use this file.
-Figure3.png&oldid=364507)
-Figure3.png)
-Figure3.png&action=edit&redlink=1)
-Figure3.png&action=history)