_(%25_of_total_employment)_Cities16.png)
 (% of total employment) Cities16.png&body=Statistics Explained - Cities with the lowest and highest proportions of their workforces commuting into the city, selected European cities, 2011 (¹) (% of total employment) Cities16.png %0A https%3A%2F%2Fec.europa.eu%2Feurostat%2Fstatistics-explained%2Findex.php%3Ftitle%3DFile%3ACities_with_the_lowest_and_highest_proportions_of_their_workforces_commuting_into_the_city%2C_selected_European_cities%2C_2011_%28%25C2%25B9%29_%28%2525_of_total_employment%29_Cities16.png)
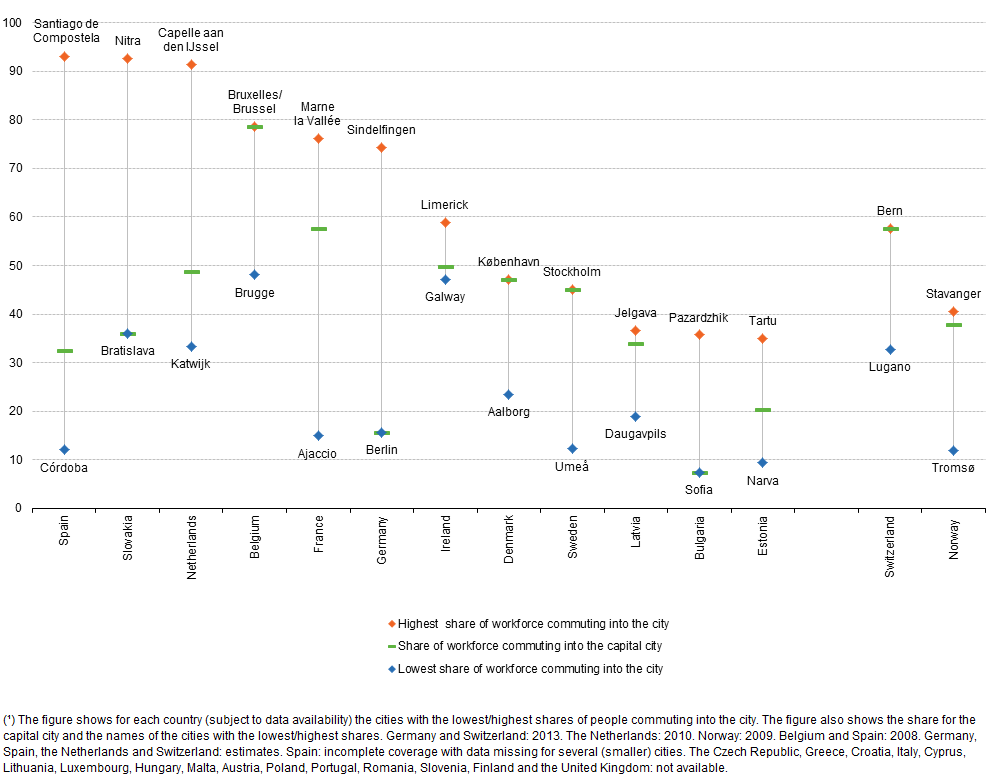
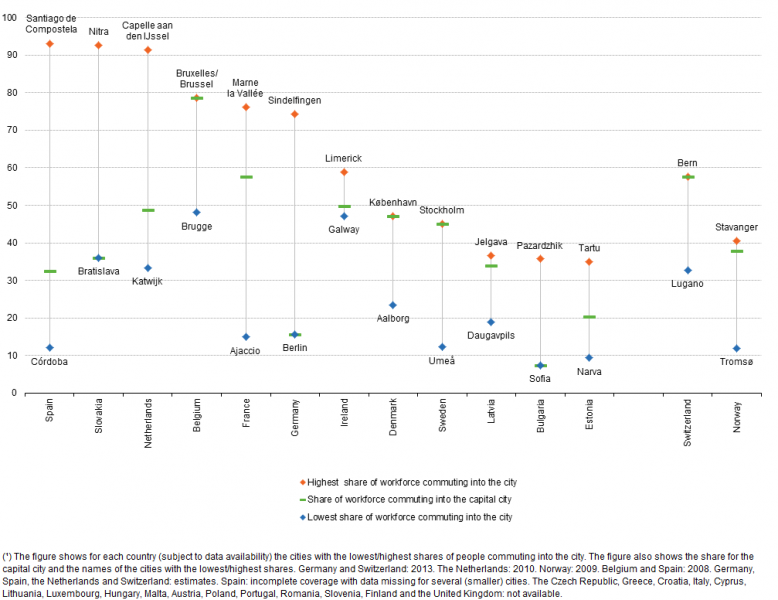
File:Cities with the lowest and highest proportions of their workforces commuting into the city, selected European cities, 2011 (¹) (% of total employment) Cities16.png
Size of this preview: 778 × 600 pixels. Other resolutions: 312 × 240 pixels | 1,007 × 776 pixels.
Original file (1,007 × 776 pixels, file size: 43 KB, MIME type: image/png)
File usage
The following page uses this file:
_(%25_of_total_employment)_Cities16.png&oldid=294408)
_(%25_of_total_employment)_Cities16.png)
_(%25_of_total_employment)_Cities16.png&action=edit&redlink=1)
_(%25_of_total_employment)_Cities16.png&action=history)