File:Changes in GVA and employment in 16 sectors, 2000–05 Average annual change.PNG

Size of this preview: 723 × 600 pixels. Other resolutions: 289 × 240 pixels | 775 × 643 pixels.
Original file (775 × 643 pixels, file size: 38 KB, MIME type: image/png)
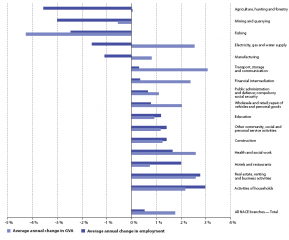
Changes in GVA and employment in 16 sectors
- 2000–05 Average annual change
Graph created with data from March 2008
File usage
The following page uses this file: