_per_inhabitant,_in_purchasing_power_standard_(PPS),_by_NUTS_2_regions,_2008_as_compared_with_2000-de.PNG)
 per inhabitant, in purchasing power standard (PPS), by NUTS 2 regions, 2008 as compared with 2000-de.PNG&body=Statistics Explained - Change of gross domestic product (GDP) per inhabitant, in purchasing power standard (PPS), by NUTS 2 regions, 2008 as compared with 2000-de.PNG %0A https%3A%2F%2Fec.europa.eu%2Feurostat%2Fstatistics-explained%2Findex.php%3Ftitle%3DFile%3AChange_of_gross_domestic_product_%28GDP%29_per_inhabitant%2C_in_purchasing_power_standard_%28PPS%29%2C_by_NUTS_2_regions%2C_2008_as_compared_with_2000-de.PNG)
File:Change of gross domestic product (GDP) per inhabitant, in purchasing power standard (PPS), by NUTS 2 regions, 2008 as compared with 2000-de.PNG

Size of this preview: 593 × 599 pixels. Other resolutions: 237 × 240 pixels | 1,232 × 1,245 pixels.
Original file (1,232 × 1,245 pixels, file size: 352 KB, MIME type: image/png)
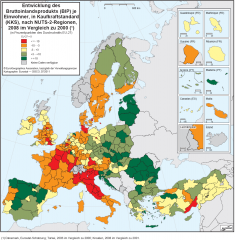
Karte 2: Entwicklung des Bruttoinlandsprodukts (BIP) je Einwohner, in Kaufkraftstandard (KKS), nach NUTS-2-Regionen, 2008 im Vergleich zu 2000 (1) (in Prozentpunkten des Durchschnitts EU-27) - Quelle: Eurostat (online Datenkode: nama_r_e2gdp)
File usage
There are no pages that use this file.
_per_inhabitant,_in_purchasing_power_standard_(PPS),_by_NUTS_2_regions,_2008_as_compared_with_2000-de.PNG&oldid=75639)
_per_inhabitant,_in_purchasing_power_standard_(PPS),_by_NUTS_2_regions,_2008_as_compared_with_2000-de.PNG)
_per_inhabitant,_in_purchasing_power_standard_(PPS),_by_NUTS_2_regions,_2008_as_compared_with_2000-de.PNG&action=edit&redlink=1)
_per_inhabitant,_in_purchasing_power_standard_(PPS),_by_NUTS_2_regions,_2008_as_compared_with_2000-de.PNG&action=history)