.png)
.png&body=Statistics Explained - Change of GDP per inhabitant, in PPS, by NUTS 2 regions, 2007 as compared with 2000 (in percentage points of the average EU-27).png %0A https%3A%2F%2Fec.europa.eu%2Feurostat%2Fstatistics-explained%2Findex.php%3Ftitle%3DFile%3AChange_of_GDP_per_inhabitant%2C_in_PPS%2C_by_NUTS_2_regions%2C_2007_as_compared_with_2000_%28in_percentage_points_of_the_average_EU-27%29.png)
File:Change of GDP per inhabitant, in PPS, by NUTS 2 regions, 2007 as compared with 2000 (in percentage points of the average EU-27).png
Size of this preview: 626 × 600 pixels. Other resolutions: 251 × 240 pixels | 692 × 663 pixels.
Original file (692 × 663 pixels, file size: 502 KB, MIME type: image/png)
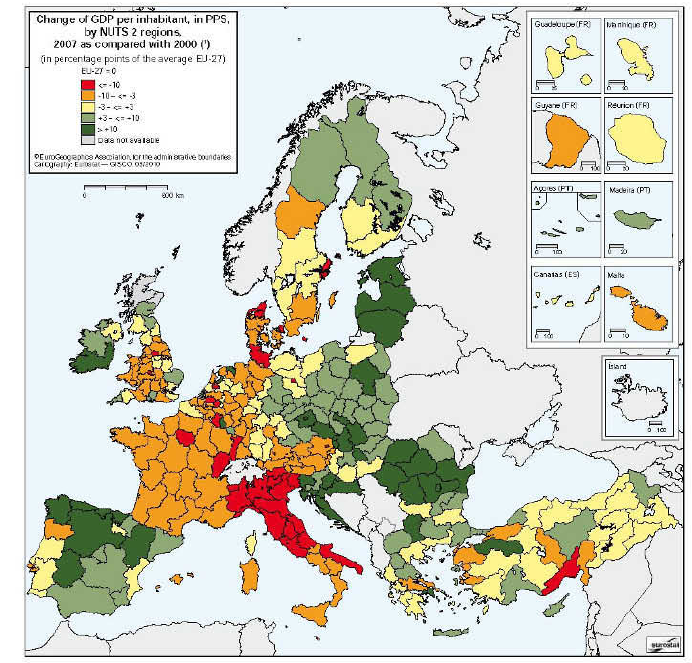
Change of GDP per inhabitant, in PPS, by NUTS 2 regions, 2007 as compared with 2000 (in percentage points of the average EU-27)
Data extracted March 2010
Most recent data available now, see:
Gross domestic product (GDP) at current market prices at NUTS level 2 (nama_r_e2gdp)]
File usage
There are no pages that use this file.
.png&oldid=45913)
.png)
.png&action=edit&redlink=1)
.png&action=history)