.PNG)
.PNG&body=Statistics Explained - Change in unemployment rate, by NUTS 2 regions, 2009 compared with 2005 (Percentage points).PNG %0A https%3A%2F%2Fec.europa.eu%2Feurostat%2Fstatistics-explained%2Findex.php%3Ftitle%3DFile%3AChange_in_unemployment_rate%2C_by_NUTS_2_regions%2C_2009_compared_with_2005_%28Percentage_points%29.PNG)
File:Change in unemployment rate, by NUTS 2 regions, 2009 compared with 2005 (Percentage points).PNG
Size of this preview: 594 × 600 pixels. Other resolutions: 238 × 240 pixels | 1,015 × 1,025 pixels.
Original file (1,015 × 1,025 pixels, file size: 269 KB, MIME type: image/png)
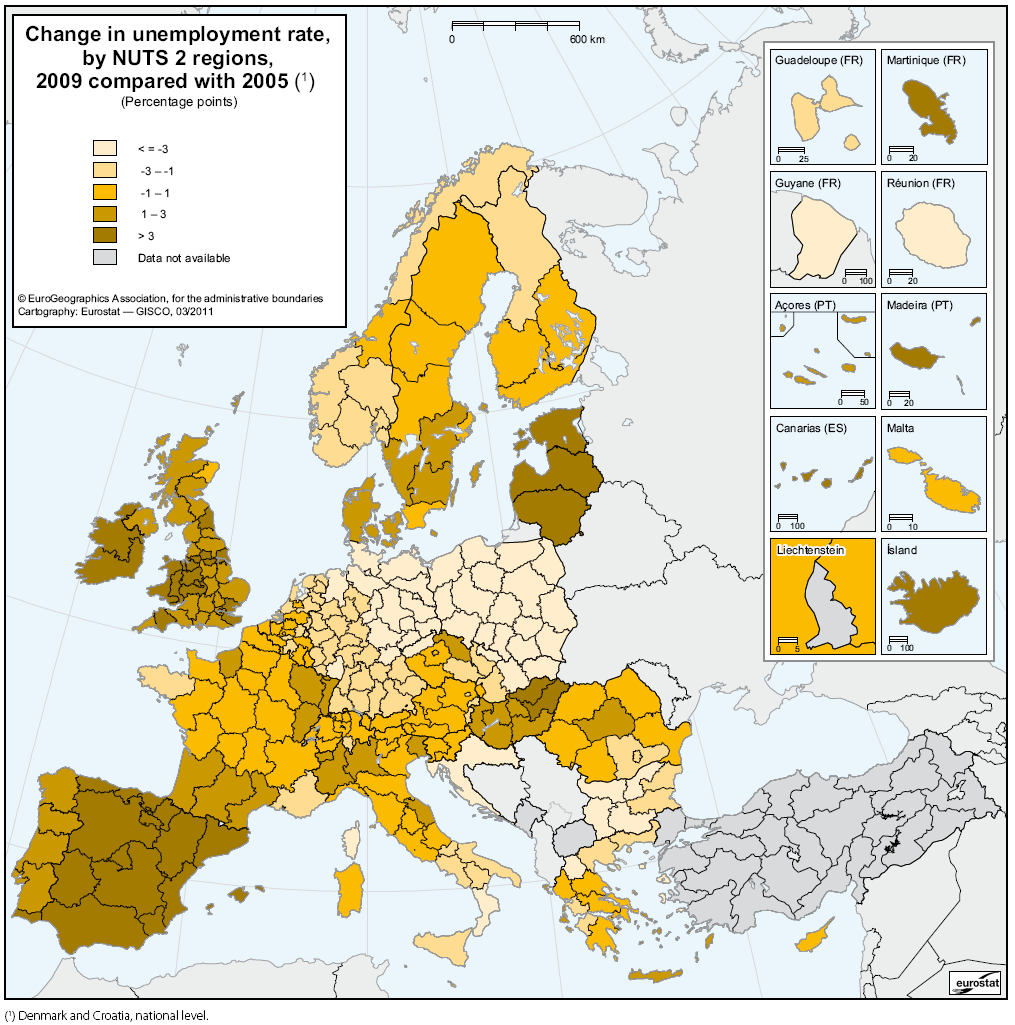
Change in unemployment rate, by NUTS 2 regions, 2009 compared with 2005
- (Percentage points)
Map created with data from March 2011
Most recent data available now, see:
Unemployment rates by sex and age, at NUTS levels 1, 2 and 3 (%) (lfst_r_lfu3rt)
File usage
There are no pages that use this file.
.PNG&oldid=70134)
.PNG)
.PNG&action=edit&redlink=1)
.PNG&action=history)