-fr.png)
-fr.png&body=Statistics Explained - Change in the share of the population aged 65 years or over between 1990 and 2010 (percentage points)-fr.png %0A https%3A%2F%2Fec.europa.eu%2Feurostat%2Fstatistics-explained%2Findex.php%3Ftitle%3DFile%3AChange_in_the_share_of_the_population_aged_65_years_or_over_between_1990_and_2010_%28percentage_points%29-fr.png)
File:Change in the share of the population aged 65 years or over between 1990 and 2010 (percentage points)-fr.png
No higher resolution available.
Change_in_the_share_of_the_population_aged_65_years_or_over_between_1990_and_2010_(percentage_points)-fr.png (573 × 319 pixels, file size: 11 KB, MIME type: image/png)
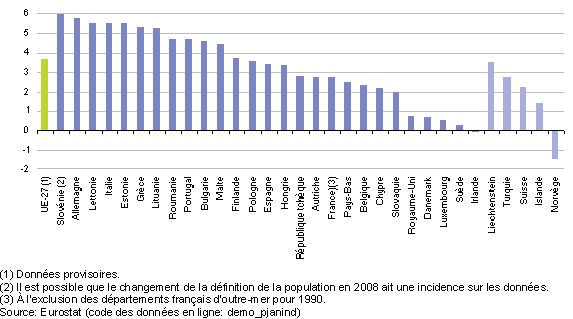
Graphique 3: Évolution de la part de la population âgée de 65 ans et plus entre 1990 et 2010
(en points de pourcentage) - Source: Eurostat (demo_pjanind)
File usage
There are no pages that use this file.
-fr.png&oldid=92558)
-fr.png)
-fr.png&action=edit&redlink=1)
-fr.png&action=history)