_RYB17.png)
 RYB17.png&body=Statistics Explained - Change in the employment rate, persons aged 20–64, by NUTS 2 regions, 2006–2016 (percentage points, difference between 2016 and 2006) RYB17.png %0A https%3A%2F%2Fec.europa.eu%2Feurostat%2Fstatistics-explained%2Findex.php%3Ftitle%3DFile%3AChange_in_the_employment_rate%2C_persons_aged_20%25E2%2580%259364%2C_by_NUTS_2_regions%2C_2006%25E2%2580%25932016_%28percentage_points%2C_difference_between_2016_and_2006%29_RYB17.png)
File:Change in the employment rate, persons aged 20–64, by NUTS 2 regions, 2006–2016 (percentage points, difference between 2016 and 2006) RYB17.png
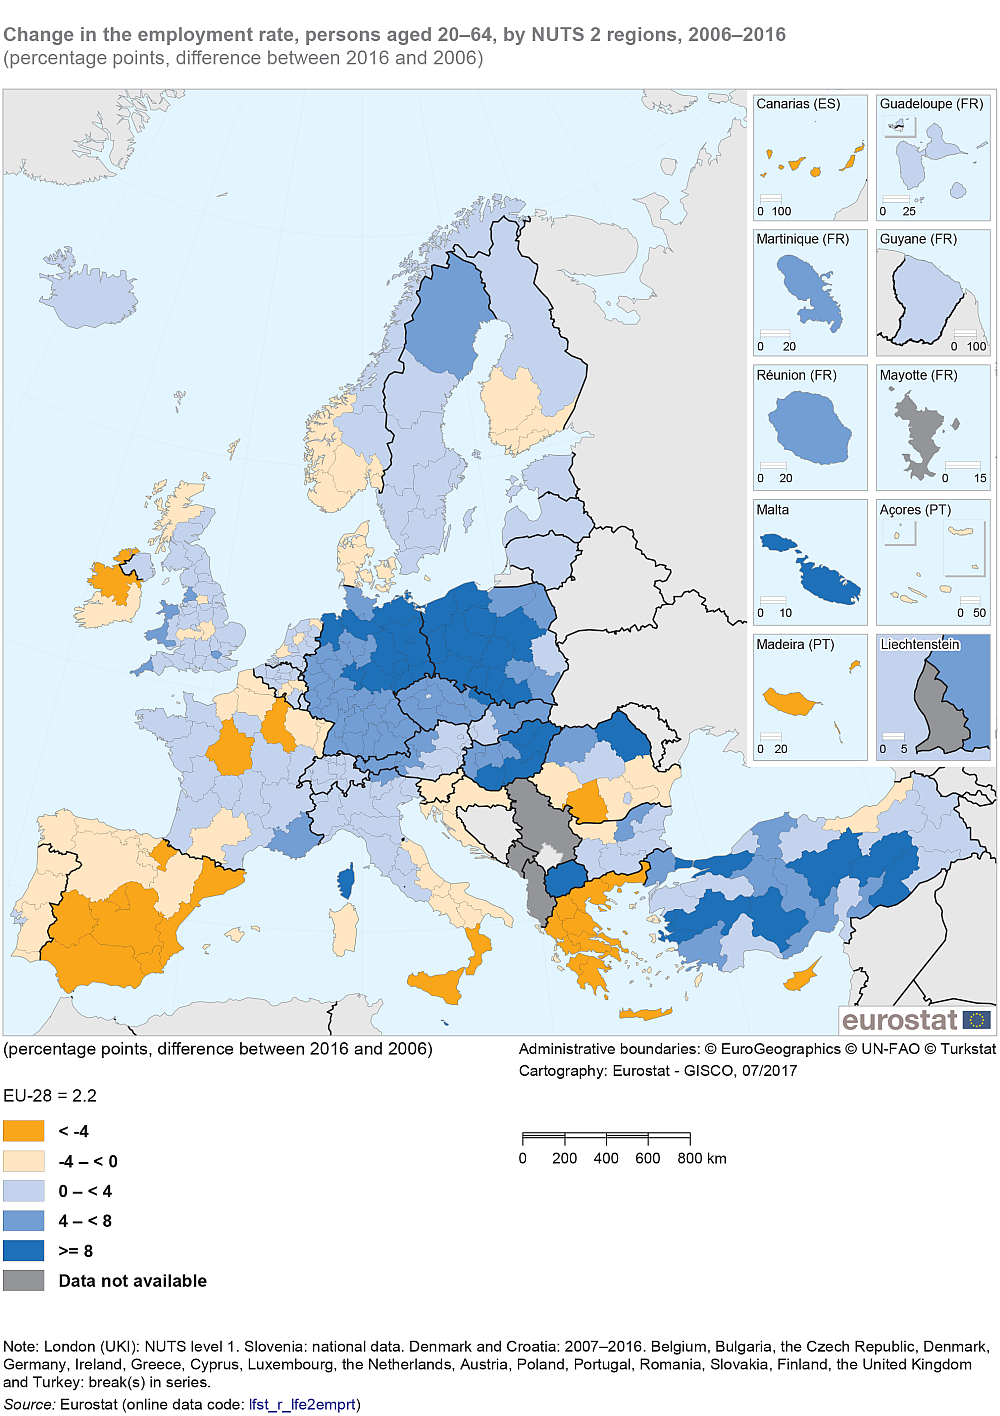
Size of this preview: 423 × 599 pixels. Other resolutions: 169 × 240 pixels | 1,000 × 1,416 pixels.
Original file (1,000 × 1,416 pixels, file size: 586 KB, MIME type: image/png)
File usage
There are no pages that use this file.
_RYB17.png&oldid=346986)
_RYB17.png)
_RYB17.png&action=edit&redlink=1)
_RYB17.png&action=history)