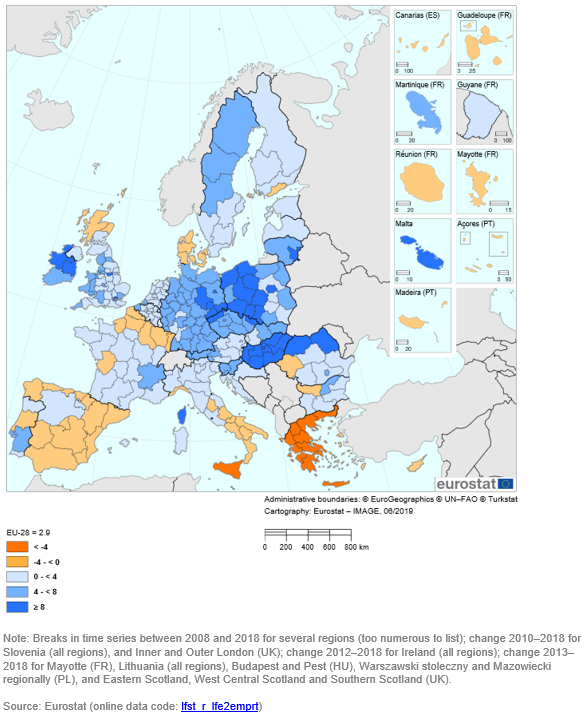
File:Change in employment rate age group 20 to 64, by NUTS 2 regions, 2008–2018.PNG
Size of this preview: 493 × 599 pixels. Other resolutions: 197 × 240 pixels | 588 × 715 pixels.
Original file (588 × 715 pixels, file size: 215 KB, MIME type: image/png)
File usage
The following page uses this file: