File:Change in deflated price indices of agricultural input and output, 2005-2009.jpg
No higher resolution available.
Change_in_deflated_price_indices_of_agricultural_input_and_output,_2005-2009.jpg (640 × 307 pixels, file size: 28 KB, MIME type: image/jpeg)
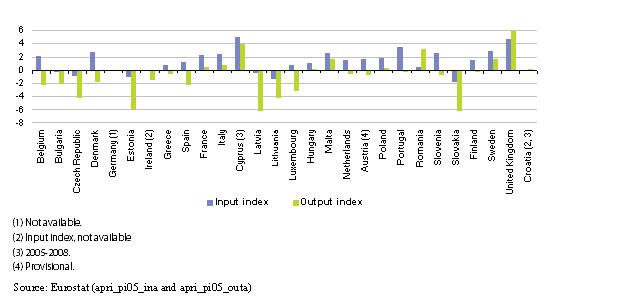
Change in deflated price indices of agricultural input and output, 2005-2009
- (average annual rate of change, %)
Figure created with data from October 2010
Most recent data available now, see:
Price indices of the means of agricultural production, input: base 2005=100 (annual) (apri_pi05_ina)
Price indices of agricultural products, output: base 2005=100 (annual) (apri_pi05_outa)
File usage
There are no pages that use this file.