.png)
.png&body=Statistics Explained - Change in UAA and fodder area, EU-27, CH, NO, 2005-2010 (in %).png %0A https%3A%2F%2Fec.europa.eu%2Feurostat%2Fstatistics-explained%2Findex.php%3Ftitle%3DFile%3AChange_in_UAA_and_fodder_area%2C_EU-27%2C_CH%2C_NO%2C_2005-2010_%28in_%2525%29.png)
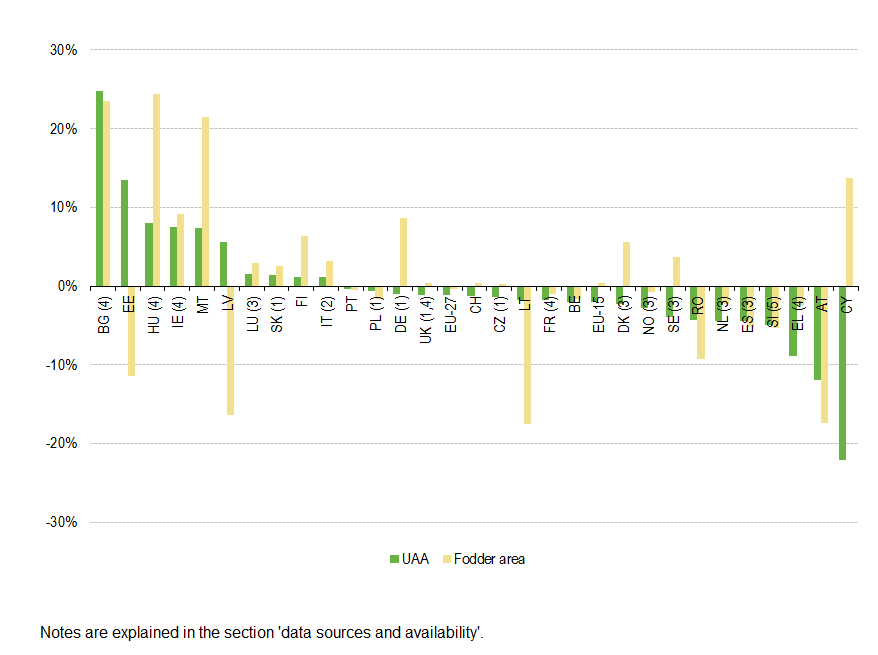
File:Change in UAA and fodder area, EU-27, CH, NO, 2005-2010 (in %).png
Size of this preview: 800 × 597 pixels. Other resolutions: 320 × 239 pixels | 878 × 655 pixels.
Original file (878 × 655 pixels, file size: 11 KB, MIME type: image/png)
Change in UAA and fodder area, EU-27, CH, NO, 2005-2010 (in %).
Figure created with data from 2005 and 2010
Data extracted at 28-05-2013 from FSS 2005 and 2010
File usage
There are no pages that use this file.
.png&oldid=151514)
.png)
.png&action=edit&redlink=1)
.png&action=history)