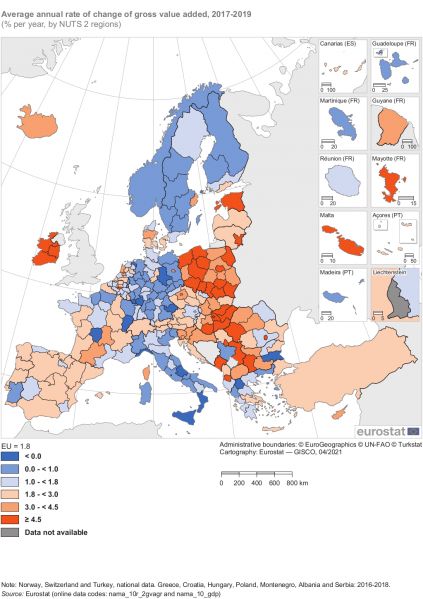
File:Average annual rate of change of gross value added, 2017-2019 (% per year, by NUTS 2 regions) RYB21.jpg

Size of this preview: 423 × 599 pixels. Other resolutions: 169 × 240 pixels | 1,023 × 1,448 pixels.
Original file (1,023 × 1,448 pixels, file size: 678 KB, MIME type: image/jpeg)
null
File usage
There are no pages that use this file.