_URE2023.png)
 URE2023.png&body=Statistics Explained - Average annual population change, by urban–rural typology, 2015–2020 (‰) URE2023.png %0A https%3A%2F%2Fec.europa.eu%2Feurostat%2Fstatistics-explained%2Findex.php%3Ftitle%3DFile%3AAverage_annual_population_change%2C_by_urban%25E2%2580%2593rural_typology%2C_2015%25E2%2580%25932020_%28%25E2%2580%25B0%29_URE2023.png)
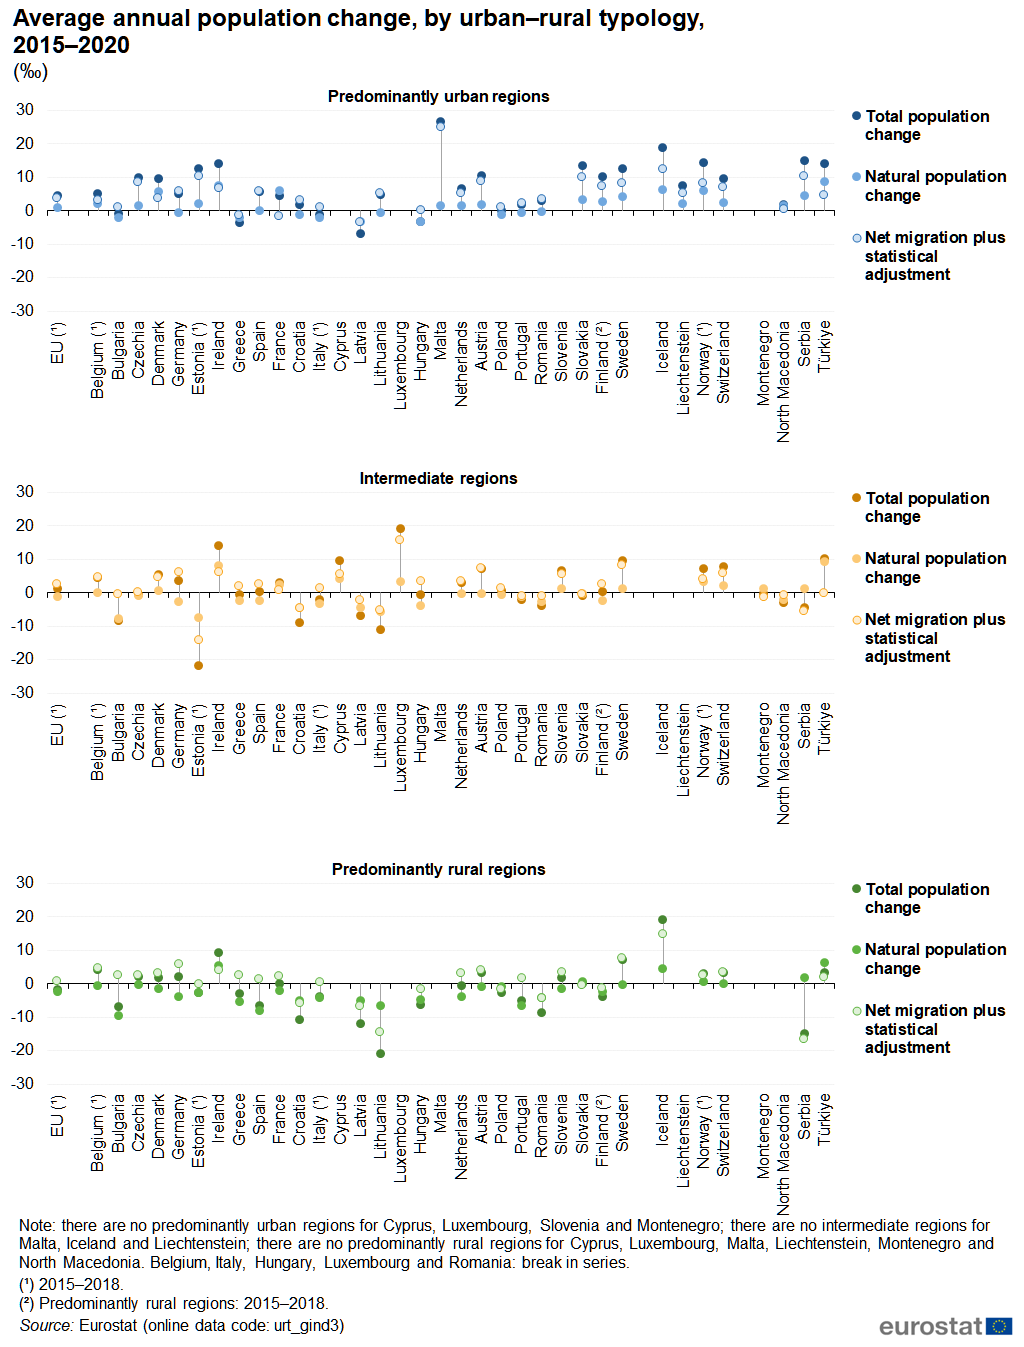
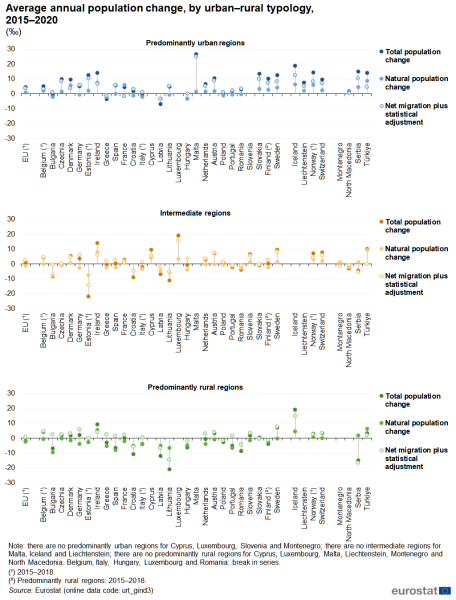
File:Average annual population change, by urban–rural typology, 2015–2020 (‰) URE2023.png
Size of this preview: 456 × 600 pixels. Other resolutions: 182 × 240 pixels | 1,024 × 1,347 pixels.
Original file (1,024 × 1,347 pixels, file size: 139 KB, MIME type: image/png)
null
File usage
The following page uses this file:
_URE2023.png&oldid=587682)
_URE2023.png)
_URE2023.png&action=edit&redlink=1)
_URE2023.png&action=history)