_(%25).PNG)
 (%).PNG&body=Statistics Explained - At-risk-of-poverty rate after social transfers by most frequent activity status, 2007 (1) (%).PNG %0A https%3A%2F%2Fec.europa.eu%2Feurostat%2Fstatistics-explained%2Findex.php%3Ftitle%3DFile%3AAt-risk-of-poverty_rate_after_social_transfers_by_most_frequent_activity_status%2C_2007_%281%29_%28%2525%29.PNG)
File:At-risk-of-poverty rate after social transfers by most frequent activity status, 2007 (1) (%).PNG
No higher resolution available.
At-risk-of-poverty_rate_after_social_transfers_by_most_frequent_activity_status,_2007_(1)_(%).PNG (612 × 581 pixels, file size: 23 KB, MIME type: image/png)
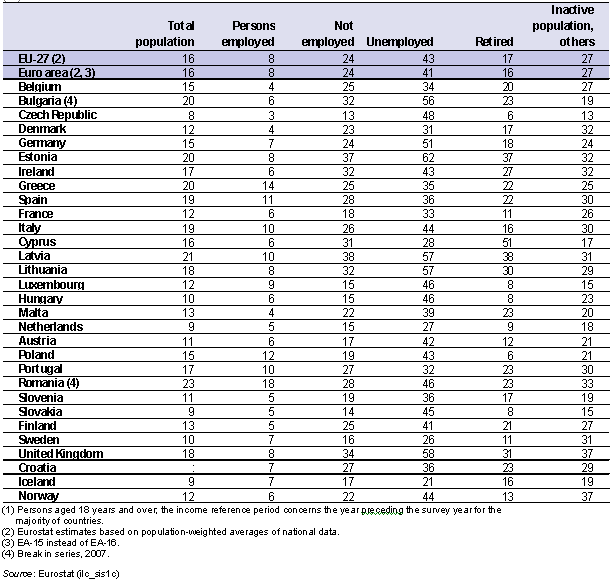
At-risk-of-poverty rate after social transfers by most frequent activity status, 2007 (1)
- (%)
Table created with data from September 2009
Most recent data available now, see:
File usage
There are no pages that use this file.
_(%25).PNG&oldid=23721)
_(%25).PNG)
_(%25).PNG&action=edit&redlink=1)
_(%25).PNG&action=history)