,_1990-2009,_EU-28,_IS,_NO,_CH_and_MK_.png)
, 1990-2009, EU-28, IS, NO, CH and MK .png&body=Statistics Explained - Annual water abstraction by sector (million m3 per year), 1990-2009, EU-28, IS, NO, CH and MK .png %0A https%3A%2F%2Fec.europa.eu%2Feurostat%2Fstatistics-explained%2Findex.php%3Ftitle%3DFile%3AAnnual_water_abstraction_by_sector_%28million_m3_per_year%29%2C_1990-2009%2C_EU-28%2C_IS%2C_NO%2C_CH_and_MK_.png)
File:Annual water abstraction by sector (million m3 per year), 1990-2009, EU-28, IS, NO, CH and MK .png

Size of this preview: 795 × 600 pixels. Other resolutions: 318 × 240 pixels | 891 × 672 pixels.
Original file (891 × 672 pixels, file size: 13 KB, MIME type: image/png)
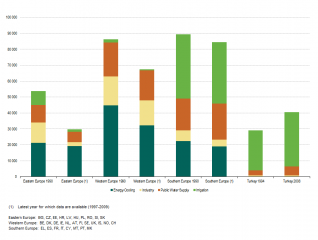
Annual water abstraction by sector (million m3 per year), 1990-2009, EU-28, IS, NO, CH and MK .png
Table created with data from 1990-2009
Data extracted in January 2012.
Source: European Environment Agency-European Topic Centre on Water (ETC/WTR) based on data from Eurostat (env_watq2)
File usage
The following page uses this file:
,_1990-2009,_EU-28,_IS,_NO,_CH_and_MK_.png&oldid=154038)
,_1990-2009,_EU-28,_IS,_NO,_CH_and_MK_.png)
,_1990-2009,_EU-28,_IS,_NO,_CH_and_MK_.png&action=edit&redlink=1)
,_1990-2009,_EU-28,_IS,_NO,_CH_and_MK_.png&action=history)