,_(2009)_.png)
, (2009) .png&body=Statistics Explained - Annual diffuse agricultural emissions of nitrogen to freshwater (kg N per ha of total land area), (2009) .png %0A https%3A%2F%2Fec.europa.eu%2Feurostat%2Fstatistics-explained%2Findex.php%3Ftitle%3DFile%3AAnnual_diffuse_agricultural_emissions_of_nitrogen_to_freshwater_%28kg_N_per_ha_of_total_land_area%29%2C_%282009%29_.png)
File:Annual diffuse agricultural emissions of nitrogen to freshwater (kg N per ha of total land area), (2009) .png
Size of this preview: 614 × 599 pixels. Other resolutions: 246 × 240 pixels | 841 × 821 pixels.
Original file (841 × 821 pixels, file size: 474 KB, MIME type: image/png)
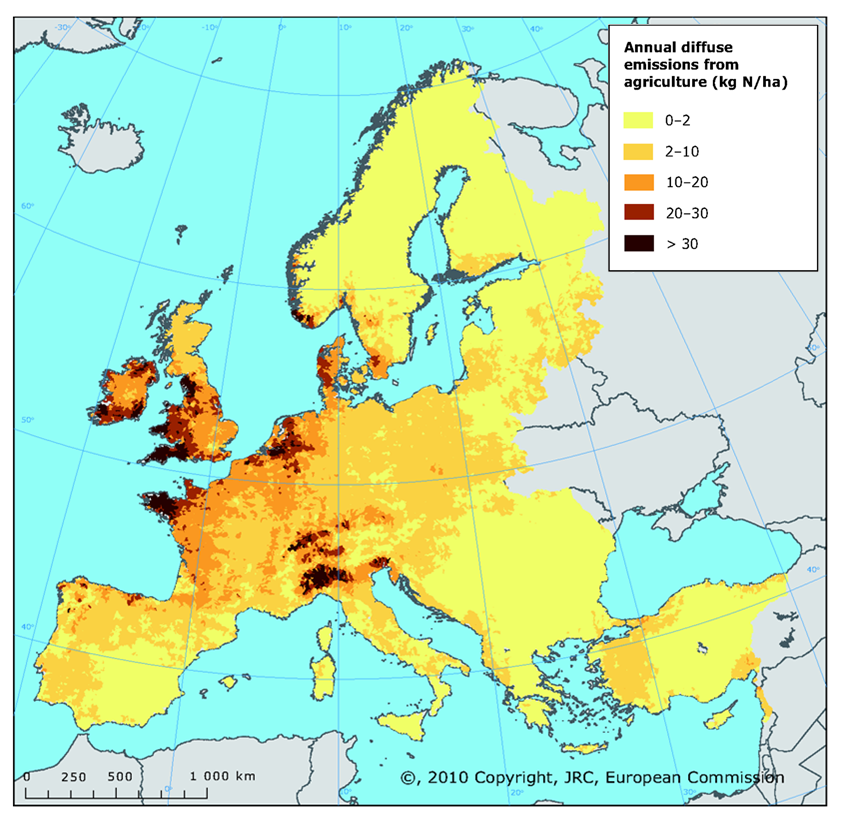
Annual diffuse agricultural emissions of nitrogen to freshwater (kg N per ha of total land area), (2009).
Graph created with data from 2009.
Data extracted in November 2012.
Source: Bouraoui,F., Grizzetti,B. and Aloe,A., 2009. Nutrient discharge from rivers to seas. JRC EUR 24002 EN
File usage
The following page uses this file:
,_(2009)_.png&oldid=127795)
,_(2009)_.png)
,_(2009)_.png&action=edit&redlink=1)
,_(2009)_.png&action=history)