-RYB18.png)
-RYB18.png&body=Statistics Explained - Annual average real rate of change for gross value added, by NUTS 2 regions, 2012-2015 (% per annum)-RYB18.png %0A https%3A%2F%2Fec.europa.eu%2Feurostat%2Fstatistics-explained%2Findex.php%3Ftitle%3DFile%3AAnnual_average_real_rate_of_change_for_gross_value_added%2C_by_NUTS_2_regions%2C_2012-2015_%28%2525_per_annum%29-RYB18.png)
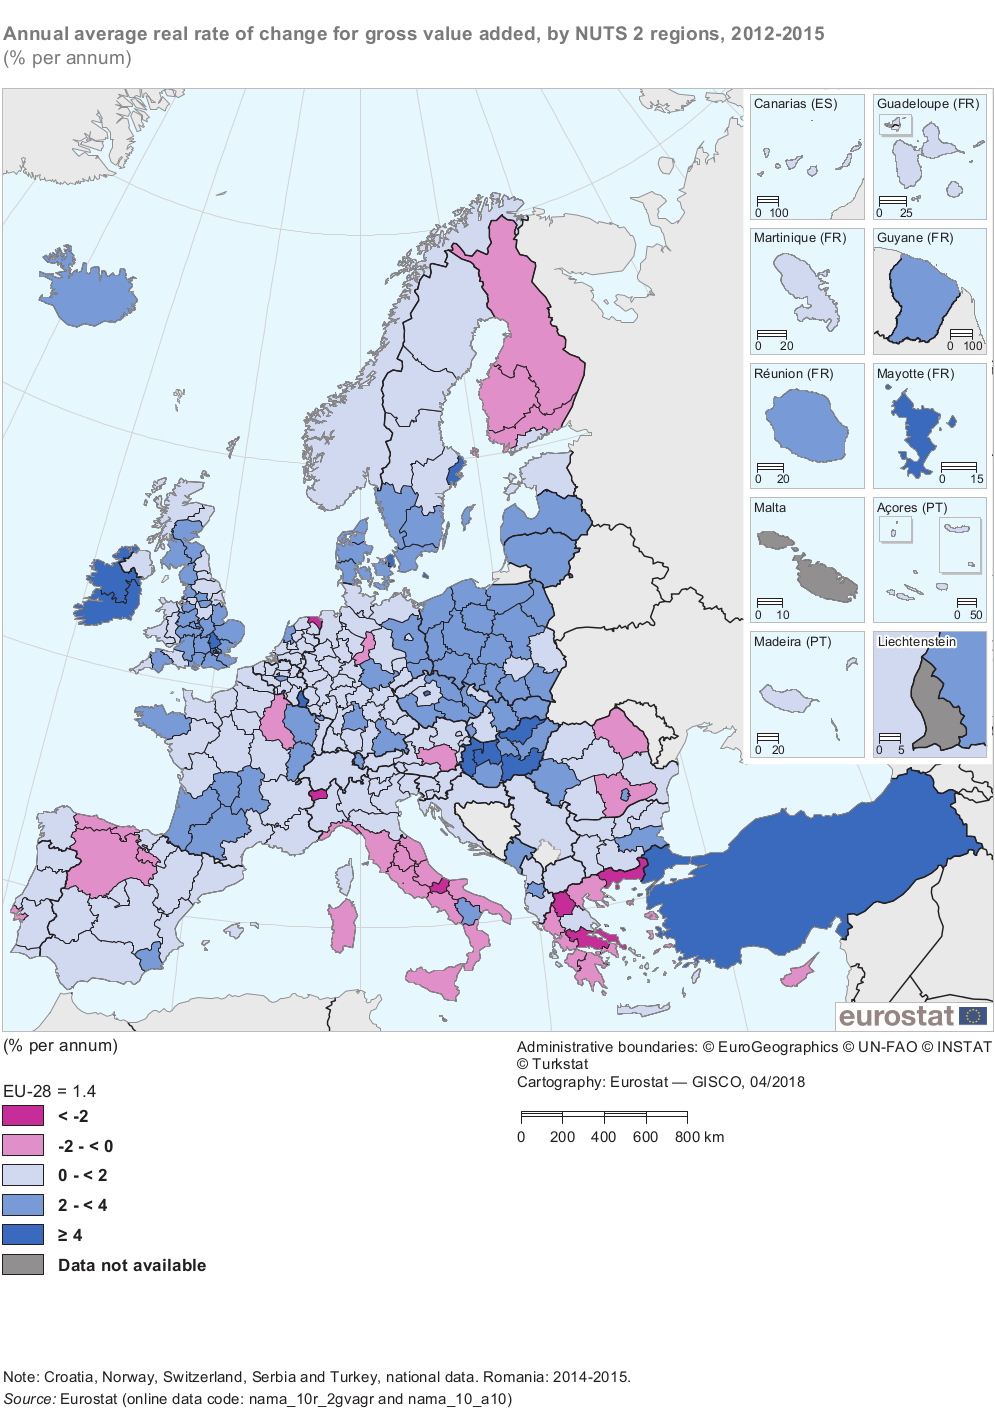
File:Annual average real rate of change for gross value added, by NUTS 2 regions, 2012-2015 (% per annum)-RYB18.png
Size of this preview: 423 × 599 pixels. Other resolutions: 169 × 240 pixels | 995 × 1,410 pixels.
Original file (995 × 1,410 pixels, file size: 444 KB, MIME type: image/png)
File usage
There are no pages that use this file.
-RYB18.png&oldid=391932)
-RYB18.png)
-RYB18.png&action=edit&redlink=1)
-RYB18.png&action=history)