,_(1992_-_2009)_.png)
, (1992 - 2009) .png&body=Statistics Explained - Annual average nitrate concentration in groundwater aggregated to different geographical regions of Europe, (mg NO3 per l), (1992 - 2009) .png %0A https%3A%2F%2Fec.europa.eu%2Feurostat%2Fstatistics-explained%2Findex.php%3Ftitle%3DFile%3AAnnual_average_nitrate_concentration_in_groundwater_aggregated_to_different_geographical_regions_of_Europe%2C_%28mg_NO3_per_l%29%2C_%281992_-_2009%29_.png)
File:Annual average nitrate concentration in groundwater aggregated to different geographical regions of Europe, (mg NO3 per l), (1992 - 2009) .png

Size of this preview: 800 × 489 pixels. Other resolutions: 320 × 196 pixels | 961 × 588 pixels.
Original file (961 × 588 pixels, file size: 28 KB, MIME type: image/png)
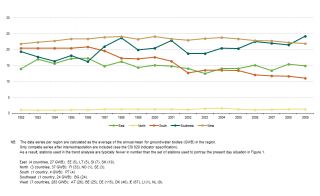
Annual average nitrate concentration in groundwater aggregated to different geographical regions of Europe, (mg NO3 per l), (1992 - 2009)
Graph created with data from 1992 - 2009.
Data extracted in November 2012. Most recent data available at:
EEA website WISE-SoE Groundwater: http://www.eea.europa.eu/data-and-maps/data/waterbase-groundwater-7
File usage
The following page uses this file:
,_(1992_-_2009)_.png&oldid=127767)
,_(1992_-_2009)_.png)
,_(1992_-_2009)_.png&action=edit&redlink=1)
,_(1992_-_2009)_.png&action=history)