._Evolution_of_main_indicators,_EU-27_(2000%3D100).PNG)
. Evolution of main indicators, EU-27 (2000=100).PNG&body=Statistics Explained - Accommodation and food services (NACE Section H). Evolution of main indicators, EU-27 (2000=100).PNG %0A https%3A%2F%2Fec.europa.eu%2Feurostat%2Fstatistics-explained%2Findex.php%3Ftitle%3DFile%3AAccommodation_and_food_services_%28NACE_Section_H%29._Evolution_of_main_indicators%2C_EU-27_%282000%253D100%29.PNG)
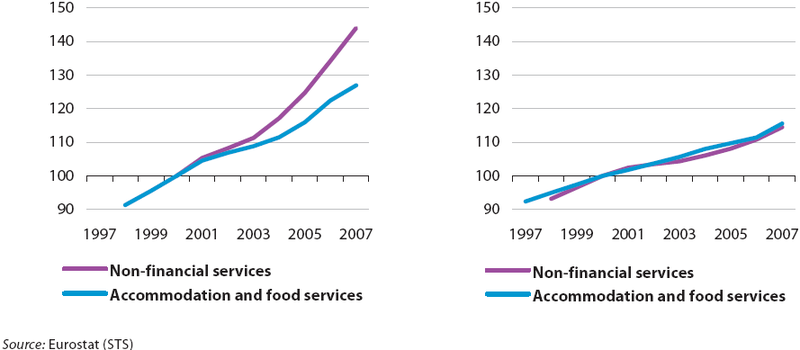
File:Accommodation and food services (NACE Section H). Evolution of main indicators, EU-27 (2000=100).PNG

Size of this preview: 800 × 350 pixels. Other resolutions: 320 × 140 pixels | 889 × 389 pixels.
Original file (889 × 389 pixels, file size: 21 KB, MIME type: image/png)
Accommodation and food services (NACE Section H). Evolution of main indicators, EU-27
- (2000=100)
Figure created with data from January 2009
File usage
The following page uses this file:
._Evolution_of_main_indicators,_EU-27_(2000%3D100).PNG&oldid=56299)
._Evolution_of_main_indicators,_EU-27_(2000%3D100).PNG)
._Evolution_of_main_indicators,_EU-27_(2000%3D100).PNG&action=edit&redlink=1)
._Evolution_of_main_indicators,_EU-27_(2000%3D100).PNG&action=history)