Archive:Consolidated supply, use and input-output tables
In 2017 European exports accounted for 15 % of total EU employment, with circa 34 million people employed
- Data extracted in December 2018. Most recent data: Further Eurostat information, Main tables and Database. Planned update of the article: December 2019.
This article presents the latest available European consolidated supply, use and input-output tables for the period from 2005 to 2017.
The consolidated supply, use and input-output tables are used for macro-analysis of the European Union (EU) and euro area (EA) economies. They give an annual snapshot of overall production and use of products, distinguishing 64 NACE activities and 64 products from the CPA classification. Input-Output Tables are particularly used as a well-established tool for analytical purposes (economic analysis, social accounting matrices, and environmental accounts). The data are broken down into 10 activities and 10 product groups.
Main statistical findings
In 2017 European exports accounted for 15 % of total EU employment, with circa 34 million people employed
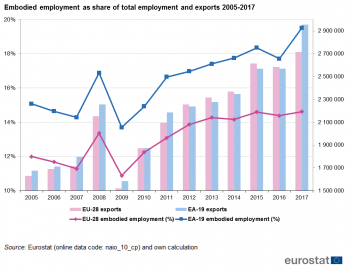
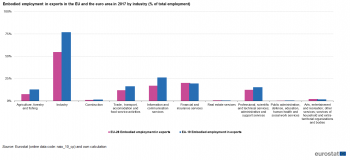
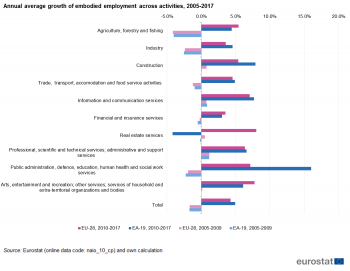
The total number of people employed by EU firms engaged in exporting activities (directly and indirectly) reached 34 million in 2017, 30 million of whom were in the EA. This represents 15 % of total EU employment in 2015 and 20 % of EA employment (see Figure 1). The figure for employment embodied in exports refers to the number of people employed by firms that are directly engaged in exporting activities (direct effects), including those employed by upstream industries for supplying the necessary inputs to these firms (indirect effects). The production of exported manufactured products remains the major contributor to employment in the EU, encompassing 19.8 million people directly and indirectly that represent 55% of the employment in manufacturing. Next in terms of size of employment come wholesale trade, transport, accommodation and food service activities, accounting for 7.1 million employed people, however only representing 12% of the employment in the trade industry. The third major contributor in size are professional, scientific and technical activities, and administrative and support service activities, with 3.8 million people employed but representing 13% of the employment in those service activities. The EA required fewer people for the production of its manufactured exports (around 17.7 million people) but those 17.7 million people represent 77% of the EA employment in manufacturing. The following industry from which its exports support the highest employment of persons is trade, transport, accommodation and food service activities with 5.2 million people, representing 16% of the employment in those services. Information and financial services exports support 20% of the employment in this services industry both in EA and EU (Figure 2). The total number of people employed by firms engaged in exporting activities in the EU and the EA has grown by an annual average rate of respectively 2.2 % and 2.7 % over the last twelve years (from 2005 to 2017). However this development comprises two opposing effects: an annual average decline of 1.7 % from 2005 to 2009, immediately followed by an annual average growth of 4.3 % in EU and 4.9 % in EA from 2010 to 2017 (Figure 3). Those two opposing effects can be seen in the activities reviewed, except for professional, scientific and technical services, administrative and support services and information and communication services where both sub-periods exhibit positive average annual growth. Real estate shows still in the EA a major negative annual growth average of -4.2 % over the second period.
Intermediate consumption represents the most costly input in the EU economy
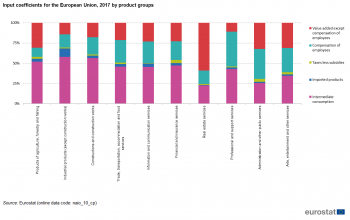
Intermediate consumption represents for agricultural, manufactured products and construction works the most costly input in the EU economy (Figure 4) accounting for 52 % to 58 % of total output in 2017. Labour input contributes between 12 % and 43 %of the EU input costs depending on the products output: below 20 % for agricultural, manufactured products and real estate services but up to 37 % in administration services or 43 % in professional and support services. Imported products represents in the EU manufactured products 11 % of the input costs. Conversely, real estate services are primarily based on the generation of gross value added, representing 59 % of total output in 2017. The input-output (I-O) tables show the production structures of an economy. The columns in the tables represent the cost structure of the industry and the rows the composition of its revenues. The value added is the difference between output and intermediate consumption.
In the EU one additional unit of final demand would create 2.2 units of industrial output
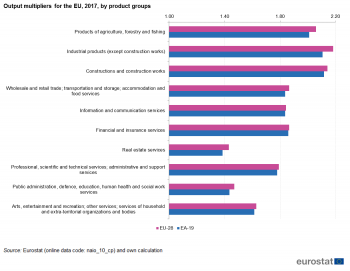
Output multipliers reflect the direct and indirect requirements of domestic production per unit of final demand. One additional unit of final demand for agricultural products would generate around two units of revenue/output in the EA and in the EU (Figure 5). In the EU, the biggest output multiplier is for industrial products, where one additional unit of final demand would create 2.2 units of output (2.1 in the EA). Output multipliers are slightly higher in the EU than in the EA, i.e. the EU economy would produce more than the EA economy in response to an increase of one unit of final demand.
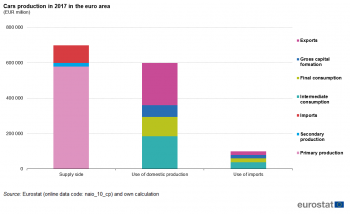
The supply and use of cars in the EA: 14 % of the production stems from imports and 37 % of the production is exported
Cars (CPA 29 of the CPA 2008 products classification) are industrial products either produced by euro area companies or imported. Of the EUR 700 billion of cars produced in 2017 in EA (EUR 858 billion in the EU), 14 % are imported from outside the EA (7 % from outside EU). The euro area domestic production of cars represents 86 % of the cars supply (93 % of domestic EU production) from which 83 % are produced by the EA car industry itself with the remaining 3 % being the secondary production of other industries. As regards use, 37 % of cars produced in EA are exported outside the euro area, 31 % are used in the EA as an intermediate consumption item in the production of another product, e.g. motor vehicles itself for 78 % of the intermediate consumption and 7 % by transport services and rental services. 19 % of cars are used as final consumption items and 12 % as investment goods. For each product, the sum of the different uses equals the total supply. Both supply and use are recorded in monetary terms, at the current prices of the reference year and in basic prices.
An additional EUR 1 spent in the car industry would increase the output of the EU in 2017 by EUR 2.41
Looking at the 10 main sectors of activities, the sector of industry including the car industry generates the biggest output multiplier on the EU economy in 2017. For an additional EUR 1 spent in the manufacturing sector, the cumulative revenues would be increased by EUR 2.18 (Euro 2.11 in the EA). An additional EUR 1 spent on cars production would generate revenue of EUR 2.41. The output multiplier for an industry is expressed as the ratio of direct and indirect output changes to the direct output change due to a unit increase in final demand. If there is an increase in final demand for a particular product, we can assume that there will be an increase in the output of that product, as producers respond to meet the increased demand; this is the direct effect. As producers increase their output, there will also be an increase in demand on their suppliers and so on down the supply chain; this is the indirect effect. The result of the direct and indirect effects will be an increase in the level of household income throughout the economy due to increased employment. A proportion of this increased income will be re-spent on final goods and services — this is the induced effect. The construction sector follows the industry sector closely with an output multiplier of 2.14 (2.16 for the EA), while the real estate services sector has the smallest output multiplier — 1.43 (1.39 for the EA).
Data sources and availability
On the basis of the European I-O tables, a standard input-output technique was used to calculate the results of the Leontief quantity model applied to employment. First, a domestic input coefficient matrix (A) was calculated for each homogeneous branch of activity, showing direct input requirements for the production of one unit of output. Then the Leontief inverse matrix (the inverse of I — A, being I, the identity matrix) was computed to obtain the matrix of output multipliers. Next, the inverse matrix was post-multiplied by a column vector of exports to calculate the total output embodied in those exports. Finally, output coefficients of employment pre-multiplied the former results to obtain the figure for employment embodied in exports.
The figure for employment embodied in exports is measured by number of persons employed by firms directly engaged in export activities (direct effects), including those employed by upstream industries for the supply of the necessary inputs (indirect effects).
Eurostat compiles supply and use tables for the EU, the euro area. All statistics relating to national accounts are now developed in the methodological framework European System of Accounts 2010.
Context
The data are collected under the European System of National and Regional Accounts (ESA 2010) transmission programme. EU Member States transmit supply and use tables (SUTs) to Eurostat annually and input-output tables (IOTs) every five years, up to 36 months after the end of the reference period.
The SUTs give detailed information on production processes, interdependencies in production, the use of goods and services, and income generated in production. They form the basis for symmetrical IOTs, which are produced by applying certain assumptions to the relationship between outputs and inputs and are used by policy-makers for input-output analysis.
European tables for the years 2010 to 2014 are based on a consolidation of available national supply and use tables. The data for only a few Member States is missing and has been estimated for the purpose of the European tables. The European tables for 2015 to 2017 are the result of projection methods based on the 2014 European consolidated tables and macroeconomic data for 2015 to 2017. Environmentally extended IOTs, an extension in Eurostat, represent another powerful analytical instrument to inform policy.
Eurostat has compiled consolidated European tables for the EU-28 and the EA in ESA 2010 from reference year 2010 onwards.
See also
- Building the System of National Accounts - supply and use tables (chapter of online publication Building the System of National Accounts)
- National accounts and GDP
- Supply and use tables - input-output analysis (background article)
Further Eurostat information
Publications
- European exports 2000-2007: direct and indirect effects on employment and labour income in the EU 27 and euro area - Statistics in focus 36/2012
- CO2 emissions induced by EU's final use of products are estimated to be 9 tonnes per capita - Statistics in focus 22/2011
Database
- Supply, use and Input-output tables (naio_10_cp)
Dedicated section
Methodology / Metadata
- Eurostat Manual of Supply, Use and Input-Output Tables
- Methodological information on the consolidated European tables for years 2008 and 2009
- Technical Documentation eeSUIOT project
External links
- International Input-Output Association (IIAO) - IIAO newsletters
- UNSD Handbook on Supply, Use and Input-Output Tables with Extensions and Applications