Archive:Biodiversity statistics
Data from December 2018
Planned article update: March 2019
Highlights
In 2016 - 2017, the size of marine protected areas in the EU increased considerably - by almost 35 %.
Nearly two thirds (62 %) of marine areas protected for biodiversity in EU waters were located around the United Kingdom, Spain and France in 2017.
Between 1990 and 2015, the population of all common birds declined by 12% in the EU.
Natura 2000 biodiversity protected terrestrial area, 2016 (thousand km²)
Biodiversity — a contraction of biological diversity — encompasses the number, variety and variability of living organisms, including humans. Given that we depend on the natural richness of our planet for the food, energy, raw materials, clean air and clean water that make life possible and drive our economies, most commentators agree it is imperative to seek to prevent a loss of biodiversity, since any loss may not only undermine the natural environment, but also our economic and social goals.
The challenges associated with preserving biodiversity have made this topic an international issue. This article examines two indicators for biodiversity in the European Union (EU) — information on protected areas (for terrestrial and marine biodiversity) and bird populations.
Full article
Habitats
Protected terrestrial areas
Areas protected for the preservation of biodiversity are proposed by the EU Member States under the Habitats Directive and under the Birds Directive. Some 790 thousand km2 of the EU-28‘s terrestrial area were protected or proposed for protection as of 2017, i.e. around 18 % of the total land area of the EU. Known as Natura 2000, it is the largest network of protected areas in the world. Natura 2000 areas do not necessarily overlap with protected areas designated under national legislation. Economic activities are allowed under Natura 2000 as long as they do not affect the conservation status of species of habitats in a negative way.
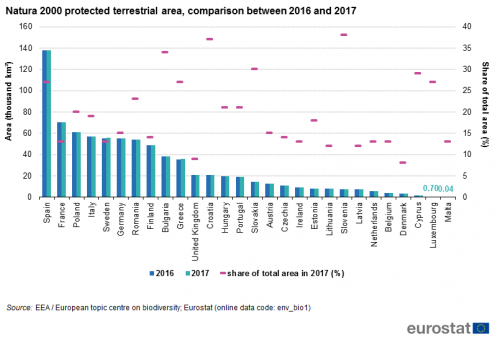
Figures for the EU Member States show that the proportion of the terrestrial area that was protected under Natura 2000 in 2017 ranged from 38 % in Slovenia, 37 % in Croatia and 34 % in Bulgaria to less than 10 % of the total areas of the United Kingdom and Denmark — see Figure 1.

Source: EEA / European topic centre on biodiversity; Eurostat (env_bio1)
The largest protected terrestrial area in absolute terms was located in Spain (138 thousand km2 in 2017). This area was almost twice the size of the next largest protected area of 71 thousand km2 in France. Romania, Germany, Sweden, Italy and Poland each reported between 54 and 61 thousand km2 of protected terrestrial area. Given that the process of designating terrestrial Natura 2000 areas is well advanced, there were only small increases in the total extent of protected areas in Member States in recent years, with Slovakia being the only EU country that has enlarged its terrestrial Natura 2000 areas by more than 1 % (1.3 %) between 2016 and 2017.
Protected marine areas
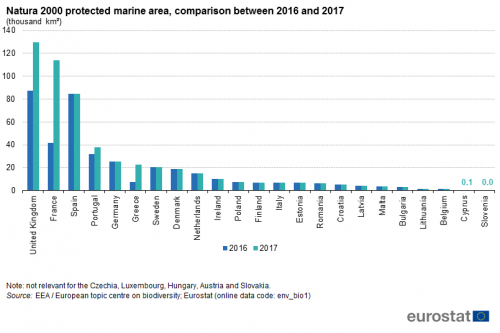
In addition to protected terrestrial areas, there were more than 530 thousand km2 of protected marine areas in EU-28 waters in 2017. This represents a remarkable inter-annual increase of almost 35 % in 2016 - 2017 for the EU as a whole. Nearly two thirds than half — 328 thousand km2 or 61.7 % — of them were located in coastal waters around the United Kingdom, Spain and France — see Figure 2. Between 2016 and 2017, some Member States achieved a considerable increase in the extent of designated marine protected areas: Greece (more than 216 %), France (more than 173 %), the United Kingdom (nearly 49 %) and Portugal (more than 19 %).

Source: EEA / European topic centre on biodiversity; Eurostat (env_bio1)
<sesection>
Common birds
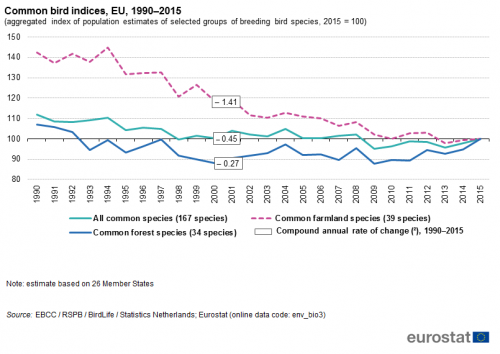
Figure 5 shows the overall change in the three bird indices (common farmland bird index, common forest bird index and index of all common birds) for the EU, expressed numerically through the compound annual rate of change (values in the boxes). This variable indicates the overall development of each of the three bird indices without taking the annual fluctuations into account. At -1.41 %, the EU value of the compound annual rate of change is highest for common farmland birds, while the value for common forest species was -0.27 % and the aggregated value of all the monitored species was -0.45 %. These numbers suggest that the populations of common farmland birds declined by approximately 37 %, whereas the populations of common forest birds and all common birds declined by 7 % and 12 %, respectively, over the period 1990 – 2015.

(aggregated index of population estimates of selected groups of breeding bird species, 2015 = 100)
Source: EBCC / RSPB / BirdLife / Statistics Netherlands; Eurostat (env_bio3)
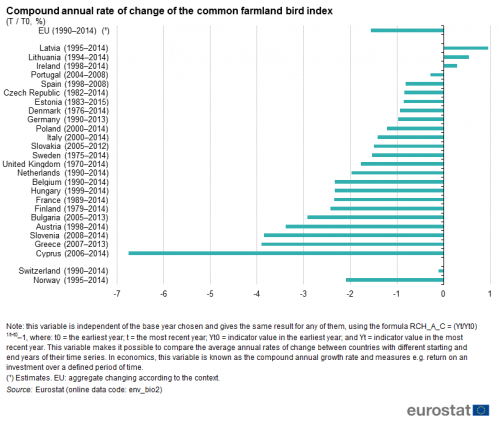
Figure 6 shows the compound annual rates of change of common farmland species at national level. The different time coverage of the data reflects each country’s participation in the pan-European common bird monitoring scheme, so there are fewer data available going back beyond 1990. The compound annual rate of change makes it possible to compare the average annual rates of change in countries with different starting and end years of their time series. Only Latvia, Lithuania and Ireland had any improvement in their farmland bird index. Eleven countries (Portugal, Spain, the Czech Republic, Estonia, Denmark, Germany, Poland, Italy, Slovakia, Sweden and the EFTA country Switzerland) have negative values, but are still above the EU average of – 1.56 %. In the remaining countries, the values indicate poorer performances, with a compound annual rate of change below – 3.00 % in Austria, Slovenia and Greece and reaching – 6.76 % in Cyprus.

(T / T0, %)
Source: Eurostat (env_bio2)
Source data for tables and graphs
Data sources
Habitats
Annual data are available on terrestrial and marine areas protected under the Habitats Directive (92/43/EEC) of 21 May 1992 on the conservation of natural habitats and of wild fauna and flora. The Directive protects over 1 000 animal and plant species and more than 200 types of habitat (for example, special types of forests, meadows or wetlands), which are considered to be of European importance. It has led to the creation of a network of protected special areas of conservation (SACs). Together with the special protection areas (SPAs) defined by the Birds Directive of 2 April 1979, codified by Directive 2009/147/EU of 30 November 2009, these areas make up the Natura 2000 network of protected areas, designed to ensure the long-term survival of Europe's most valuable and threatened species and habitats.
Birds
Across the EU, the conservation of wild birds is covered by Council Directive 79/409/EEC of 2 April 1979, as codified by Directive 2009/147/EU of 30 November 2009. Birds are considered to be good proxies for measuring the diversity and integrity of ecosystems as they tend to be near the top of the food chain, have large ranges and the ability to move elsewhere when their environment becomes unsuitable; they are therefore responsive to changes in their habitat. Birds are thus a recognised ecological indicator taxon.
The EU indices are based on data from 26 EU Member States (data for Croatia and Malta are not available), derived from annually operated surveys of national breeding birds collated by the Pan-European Common Bird Monitoring Scheme (PECBMS); these data are considered to be a good proxy for the whole of the EU.
Three different indices are presented:
- Common farmland birds (39 species)
- Common forest birds (34 species)
- All common birds (167 species)
For the first two categories, the bird species have a high dependence on agricultural or on forest habitats in the nesting season and for feeding. Both groups comprise year-round residents and migratory species. The index ‘All common birds’ comprises farmland and forest species together with other common species that are generalists, meaning that they occur in many different habitats or are particularly adapted to life in cities.
Context
Many aspects of the natural environment are public goods, in other words, they have no market value or price. As such, the loss of biodiversity can often go undetected by economic systems. However, the natural environment also provides a range of intangibles, such as the aesthetic pleasure derived from viewing landscapes and wildlife, and recreational opportunities. In order to protect this legacy for future generations, the EU seeks to promote policies in a range of areas to ensure that biodiversity is protected through the sustainable development of, among others, agriculture, rural and urban landscapes, energy provision and transport.
The EU’s biodiversity strategy is based on the implementation of two landmark Directives, the Habitats Directive (92/43/EEC) of 21 May 1992 and the Birds Directive (79/409/EEC)) of 2 April 1979, as codified by Directive 2009/147/EU of 30 November 2009. Implementation of these Directives has involved the establishment of a coherent ecological network of sites under the title Natura 2000. In December 2016, Natura 2000 counted 27 522 sites covering a land area of 789 thousand km2 and a marine area of 396 thousand km2 where wild species and their habitats were protected. Establishing the Natura 2000 network may be seen as the first pillar of action relating to nature conservation. EU legislation has also established a second pillar through strict protection regimes for certain animal species (for example, the Arctic fox and the Iberian lynx, both of which are under serious threat of extinction).
In 1998, the EU adopted a biodiversity strategy. Four action plans covering the conservation of natural resources, agriculture, fisheries, and economic and development cooperation were subsequently agreed as part of this strategy in 2001.
In May 2011, the European Commission adopted the Communication ‘Our life insurance, our natural capital: an EU biodiversity strategy to 2020’ (COM(2011) 244 final), aimed at halting the loss of biodiversity and ecosystem services in the EU by 2020. Biodiversity loss is seen as a considerable challenge in the EU, with around one in four species currently threatened with extinction and 58 % of fish stocks over-exploited or significantly depleted. There are six main targets and 20 actions to help reach this goal. The six targets cover:
- Full implementation of EU nature legislation to protect biodiversity;
- Better protection for ecosystems and more use of green infrastructure;
- More sustainable agriculture and forestry;
- Better management of fish stocks;
- Tighter controls on invasive alien species;
- Greater EU contribution to averting global biodiversity loss.
The strategy is in line with two commitments made in March 2010:
- The 2020 headline target — halting the loss of biodiversity and the degradation of ecosystem services in the EU by 2020, and restoring them insofar as feasible, while stepping up the EU’s contribution to averting global biodiversity loss;
- The 2050 vision — which foresees that by 2050, the EU’s biodiversity and the ecosystem services it provides — its natural capital — are protected, valued and appropriately restored for biodiversity’s intrinsic value, for their essential contribution to human well-being and economic prosperity, and to avoid catastrophic changes caused by the loss of biodiversity.
The strategy is in line with global commitments made in Nagoya (Japan) in October 2010, in the context of the Convention on biological diversity, where world leaders agreed a package of measures to address global biodiversity loss over the coming decade; 92 countries signed this United Nations protocol, while 89 countries ratified it. The Nagoya Protocol entered into force on 12 October 2014.
In 2015, the European Commission reviewed the EU biodiversity strategy to 2020 at mid-term to see whether it was on track to reach its targets. The review found that no significant progress towards the 2020 headline target had been made. The only target found to be on track was the one on combating invasive alien species. To step up actions and bring us closer to to meeting the goals of the EU Biodiversity Strategy to 2020, in May 2017, the European Commission adopted the Nature Action Plan (An Action Plan for nature, people and the economy).
Direct access to
- Environment, see:
- Biodiversity (t_env_biodiv)
- Sufficiency of sites designated under the EU Habitats directive (tsdnr210)
- Common bird index (tsdnr100)
Database
- Environment (env), see:
- Biodiversity (env_biodiv)
- Protected Areas for biodiversity: Habitats Directive (env_bio1)
- Common farmland bird index (env_bio2)
- Common bird indices by type of estimate (EU aggregate) (env_bio3)
- Communication 'Halting the loss of biodiversity by 2010 — and beyond — Sustaining ecosystem services for human well-being' COM(2006) 216 final
- Communication 'Our life insurance, our natural capital: an EU biodiversity strategy to 2020' (COM(2011) 244)
- Directive 79/409/EEC ('Birds Directive') of 2 April 1979 on the conservation of wild birds
- Directive 79/409/EEC ('Habitats Directive') on the conservation of natural habitats and of wild fauna and flora