-fr.png)
-fr.png&body=Statistics Explained - FDI flows and stocks, EU-27, 2004-2010 (EUR 1 000 million)-fr.png %0A https%3A%2F%2Fec.europa.eu%2Feurostat%2Fstatistics-explained%2Findex.php%3Ftitle%3DFile%3AFDI_flows_and_stocks%2C_EU-27%2C_2004-2010_%28EUR_1_000_million%29-fr.png)
File:FDI flows and stocks, EU-27, 2004-2010 (EUR 1 000 million)-fr.png
Revision as of 16:24, 3 September 2012 by EXT-H-McCormack (talk | contribs) (Graphique 1: Flux et stocks d’IDE, UE-27, 2004-2010<br>(en milliards d’euros) - Source: Eurostat {{Stable link|title=|code=bop_fdi_main}})
-fr.png)
-fr.png&diff=cur&oldid=99293)
-fr.png&direction=next&oldid=99293)
-fr.png&diff=next&oldid=99293)

Size of this preview: 679 × 600 pixels. Other resolutions: 272 × 240 pixels | 795 × 702 pixels.
Original file (795 × 702 pixels, file size: 32 KB, MIME type: image/png)
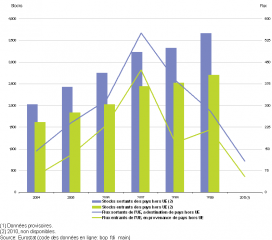
Graphique 1: Flux et stocks d’IDE, UE-27, 2004-2010
(en milliards d’euros) - Source: Eurostat (bop_fdi_main)
File usage
There are no pages that use this file.
-fr.png&oldid=99293)
-fr.png&action=edit&redlink=1)
-fr.png&action=history)