Archive:Manufacture of leather and related products statistics - NACE Rev. 2
- Data from April 2012. Most recent data: Further Eurostat information, Main tables and Database.
This article presents an overview of statistics for leather and related products manufacturing in the European Union (EU), as covered by NACE Rev. 2 Division 15.


(% share of sectoral total) - Source: Eurostat (sbs_na_ind_r2)


Main statistical findings
Structural profile
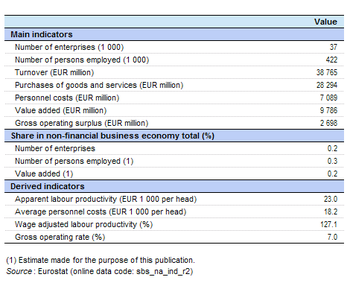
There were 37 thousand enterprises operating with leather and related products manufacturing (Division 15) as their main activity in the EU-27 in 2009. Together they employed 422 thousand persons, equivalent to 0.3 % of the total number of persons employed in the non-financial business economy (Sections B to J and L to N and Division 95) and 1.4 % of the manufacturing (Section C) workforce. They generated EUR 9 786 million of value added which was 0.2 % of the non-financial business economy total and 0.7 % of the manufacturing total.
The apparent labour productivity of the EU-27's leather and related products manufacturing sector in 2009 was EUR 23 thousand per person employed. This was the second lowest level of apparent labour productivity among the manufacturing NACE divisions in 2009 (higher only than the manufacture of wearing apparel, Division 14) and was half the manufacturing average (EUR 46 thousand per person employed). In line with this low apparent labour productivity ratio, the EU-27’s leather and related products manufacturing sector also recorded a low level of average personnel costs, EUR 18.2 thousand per employee in 2009. This was also the second lowest value across the manufacturing NACE divisions, and was a little more than half the manufacturing average (EUR 34.5 thousand per employee). As for wearing apparel manufacturing, these relatively low values may reflect an above average incidence of part-time work, as both of these indicators are compiled on a per head basis using a simple head count. In contrast, the wage-adjusted labour productivity ratio combines the two previous indicators in percentage terms; and shows the extent to which value added per person employed covers average personnel costs per employee. This latter ratio was 127.1 % for the EU-27’s leather and related products manufacturing sector in 2009, 5.0 percentage points below the manufacturing average (132.1 %).
The gross operating rate for the EU-27’s leather and related products manufacturing sector in 2009 shows that the gross operating surplus was 7.0 % of turnover), the same rate as recorded for manufacturing as a whole, and therefore below the non-financial business economy average (9.7 %).
Sectoral analysis
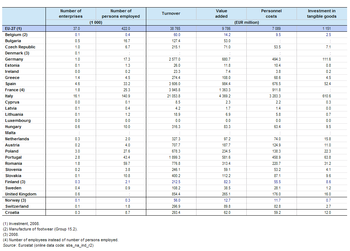
The manufacture of footwear (Group 15.2) was the largest of the two subsectors within the EU-27’s leather and related products manufacturing sector. Footwear manufacturing enterprises made up 58.7 % of the enterprise population, and they generated 57.1 % of sectoral value added and employed close to 70 % of the sectoral workforce. The remaining subsector, tanning and dressing of leather, dressing and dyeing of fur, and the manufacture of other leather products such as luggage, handbags, saddlery and harnesses (Group 15.1; hereafter referred to as leather and fur processing) accounted for the remainder.
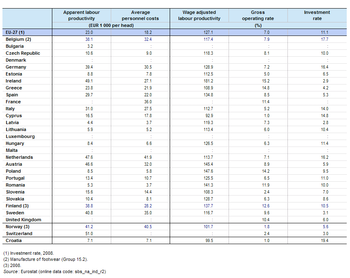
Apparent labour productivity per person employed varied greatly between the two leather subsectors in the EU-27, ranging from EUR 19 thousand for footwear manufacturing in 2009 to EUR 33 thousand (2008 data) for the smaller subsector of leather and fur processing. Equally, average personnel costs per employee were much lower for footwear manufacturing (EUR 15.1 thousand) than they were for the leather and fur processing subsector (EUR 24.9 thousand, 2008 data). The wage-adjusted labour productivity ratio was more balanced, with the leather and fur processing subsector recording a ratio of 132.2 % in 2008 and the footwear manufacturing subsector a ratio of 125.7 % in 2009. A direct comparison of the two subsectors using 2008 data shows that the footwear manufacturing subsector had notably lower apparent labour productivity and average personnel costs than the leather and fur processing subsector, but its wage-adjusted labour productivity ratio in 2008 was higher, standing at 135.6 %.
Country analysis
As for the manufacture of textiles (Division 13) and wearing apparel, the largest Member State (in value added terms) in the EU-27’s leather and related products manufacturing sector in 2009 was Italy. Italy’s share of the EU-27’s wearing apparel manufacturing sector was 44.6 % in 2009, the highest share for Italy in any of the non-financial business economy NACE divisions (with data available) in 2009. Italy’s share of EU-27 value added ranged from 44.3 % for the leather and fur processing subsector to 44.9 % for footwear manufacturing. The only other Member States with a double-digit share of value added in the EU-27’s leather and related products manufacturing sector in 2009 were France (13.9 %) and Spain (10.1 %). Nevertheless, the 5.9 % share of EU-27 value added recorded for Portugal in this sector was the highest share for Portugal in any of the non-financial business economy NACE divisions (with data available) in 2009. In terms of the workforce, the Italian share was slightly smaller, 33.4 % of the EU-27 total, while Romania (14.1 %) and Portugal (10.3 %) both contributed larger shares of those employed within the EU-27 than either Spain (7.9 %) or France (6.0 %, based on employees).
The relative importance of the leather and related products manufacturing sector in value added terms was highest in Portugal, Italy and Romania where it accounted for 0.7 % or more of non-financial business economy value added, and this share was 0.5 % in Slovakia. In many Member States this sector accounted for a very small share of non-financial business economy value added, less than 0.1 % in the Czech Republic, Lithuania, Germany, the Netherlands, the United Kingdom, Cyprus, Sweden, Latvia, Ireland and Luxembourg, as well as in Switzerland. In the largest subsector, namely footwear manufacturing, Portugal, Romania, Slovakia, Italy and Bulgaria were the most specialised Member States, whereas Italy was by far the most specialised Member State for leather and fur processing, followed at some distance by Slovenia and France.
Data sources and availability
The analysis presented in this article is based on the main dataset for structural business statistics (SBS) which are disseminated annually. The series provides information for each Member State as well as a number of non-member countries at a detailed level according to the activity classification NACE. Data are available for a wide range of variables.
Context
This article presents an overview of statistics for the leather and related products manufacturing sector in the EU, as covered by NACE Rev. 2 Division 15. This division includes the dressing and dyeing of fur and the transformation of hides into leather by tanning or curing, as well as fabricating leather into products for final consumption. The manufacture of footwear includes footwear for all purposes, of any material, by any process, including moulding. It also includes the manufacture of similar products from other materials (imitation leathers or leather substitutes), such as rubber footwear, textile luggage and so on.
This NACE division is composed of two groups:
- the tanning and dressing of leather, dressing and dyeing of fur; the manufacture of other leather products such as luggage, handbags, saddlery and harnesses (Group 15.1);
- the manufacture of footwear (Group 15.2).
Note that the manufacture of wooden, rubber or plastic shoe parts is excluded (and classified as part of wood, rubber or plastic manufacturing). Leather wearing apparel, gloves and hats are classified as part of the manufacture of wearing apparel (Division 14).
Further Eurostat information
Publications
Main tables
Database
- SBS - industry and construction (sbs_ind_co)
- Annual detailed enterprise statistics - industry and construction (sbs_na_ind)
- Annual detailed enterprise statistics for industry (NACE Rev.2 B-E) (sbs_na_ind_r2)
- Preliminary results on industry and construction, main indicators (NACE Rev.2) (sbs_na_r2preli)
- SMEs - Annual enterprise statistics broken down by size classes - industry and construction (sbs_sc_ind)
- Industry broken down by employment size classes (NACE Rev.2 B-E) (sbs_sc_ind_r2)
- Annual detailed enterprise statistics - industry and construction (sbs_na_ind)
- SBS - regional data - all activities (sbs_r)
- SBS data by NUTS 2 regions and NACE Rev.2, from 2008 onwards (sbs_r_nuts06_r2)
Dedicated section
Source data for tables, figures and maps (MS Excel)
Other information
- Regulation 58/1997 of 20 December 1996 concerning structural business statistics
- Decision 2367/2002/EC of 16 December 2002 on the Community statistical programme 2003 to 2007
- Regulation 295/2008 of 11 March 2008 concerning structural business statistics