Archive:HICP - household consumption patterns
The consumption patterns of households determine the relative importance (weight) of household monetary expenditure that is attached to each of the categories of goods and services covered by the HICP.
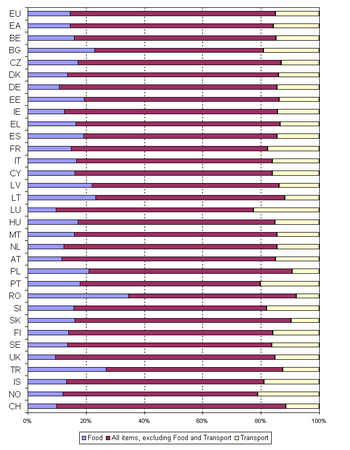
In 2007, the three main headings food, housing and transport, each accounting for around 15% of consumption expenditure, were those with the largest weights in both country groups: the EU and the euro area.
Main statistical findings
The consumption patterns of households determine the relative importance (weight) of household monetary expenditure that is attached to each of the categories of goods and services covered by the HICP. The impact on the all-items index of any price change is proportional to the size of the corresponding weight. There is no uniform basket applying to all Member States. The structure of the weights may vary considerably between the HICPs for individual Member States as well as between the HICP for an individual Member State and the average weighting structure according to the EU or the euro area. The HICP is computed as an annual chain-index, allowing weights to change each year.
In 2007, the three main headings food, housing and transport, each accounting for around 15% of consumption expenditure, were those with the largest weights in both country groups: the EU and the euro area. A weight of around one tenth is attached to recreation and culture, though it is a little more important for the whole EU than for the euro area. Only just below are the weights for restaurants and hotels, which again are slightly higher for the EU.
Within the national HICPs the weight for food varies between 10–12% (the United Kingdom, Luxembourg, Germany and Austria) and 36% (Romania). The share for transport in HFMCE ranges from 8–12% (Romania, Lithuania and Latvia) to 19–22% (Slovenia, Portugal and Luxembourg). Consumption expenditure on recreation and culture ranges from 5% (Romania, Portugal and Greece) to 12–15% (Sweden and the United Kingdom). The weight for housing ranges from 9% (Malta, Cyprus, Greece and Luxembourg) to 19–23% (Romania, Germany, Slovakia and Poland). In the housing category, it should be noted that HICPs reflect only monetary expenditure; unlike national accounts or household budget surveys, they do not cover services provided by owner occupied dwellings. This means that countries in which a larger proportion of the population lives in rented dwellings tend to have a larger weight for housing than countries in which a larger proportion of households live in their own dwellings.
Data sources and availability
Importance of Member States' consumption expenditure
The weight of a Member State in the euro area or in the EU is its share of household final monetary consumption expenditure in the totals. The country weights used in 2007 are based on national accounts data for 2005 updated to December 2006 prices. For the euro area, weights in national currencies are converted into euro using the irrevocably locked exchange rates. For the EU, weights in national currencies are converted into purchasing power standards. The weight of the euro area reflects its share in the EU total.

