File:Euro area trade by product, 2010.PNG
Revision as of 14:49, 5 June 2012 by Cadicsy (talk | contribs) (→Graph created with data from May 2011)
No higher resolution available.
Euro_area_trade_by_product,_2010.PNG (627 × 315 pixels, file size: 8 KB, MIME type: image/png)
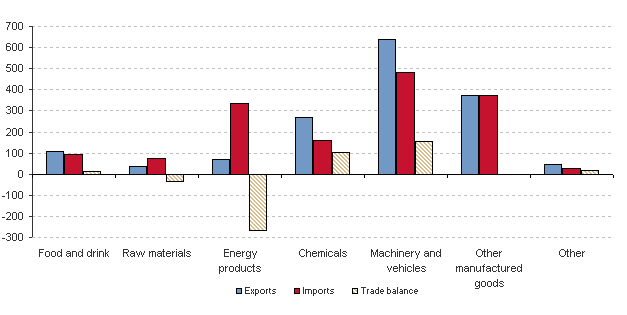
Euro area (EA17) trade by product, 2011
- Billion EUR
Graph created with data from May 2012
Most recent data available now, see:
File usage
There are no pages that use this file.