File:Malignant neoplasms by NUTS 2 regions, 2008.PNG

Size of this preview: 572 × 599 pixels. Other resolutions: 229 × 240 pixels | 791 × 829 pixels.
Original file (791 × 829 pixels, file size: 178 KB, MIME type: image/png)
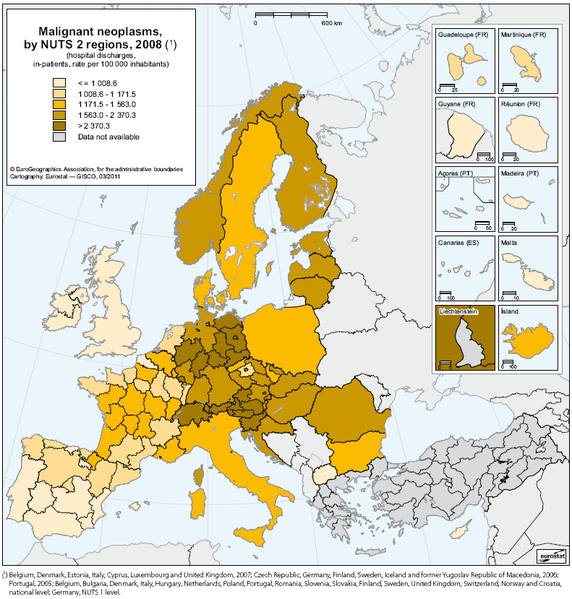
Malignant neoplasms by NUTS 2 regions, 2008
- (hospital discharges, in-patients, rate per 100 000 inhabitants)
Map created with data from March 2011
Most recent data available now, see:
File usage
The following page uses this file: