Archive:Sustainable development - socioeconomic development
- Data from July 2011, most recent data: Further Eurostat information, Database.
This article provides an overview of statistical data on sustainable development in the areas of socioeconomic development. They are based on the set of sustainable development indicators the European Union agreed upon for monitoring its sustainable development strategy. Together with similar indicators for other areas, they make up the report 'Sustainable development in the European Union - 2011 monitoring report of the EU sustainable development strategy', which Eurostat draws up every two years to provide an objective statistical picture of progress towards the goals and objectives set by the EU sustainable development strategy and which underpins the European Commission’s report on its implementation.
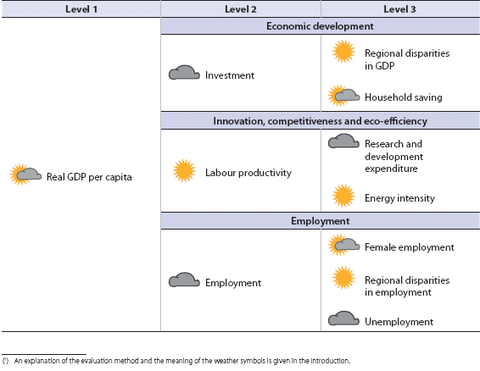
The table below summarises the state of affairs of in the area of socioeconomic development. Quantitative rules applied consistently across indicators, and visualised through weather symbols, provide a relative assessment of whether Europe is moving in the right direction, and at a sufficient pace, given the objectives and targets defined in the strategy.
Overview of main changes
Many of the long-term trends in the socioeconomic development theme have been influenced, either positively or negatively, by the recent global economic and financial crisis. In this respect trends have deteriorated in the short term in particular in investment, employment and unemployment, as well as in real GDP per capita and labour productivity, even if these last two have started to pick up again. On the other hand, improvements have been seen in R&D expenditure and energy intensity, and briefly in household saving.
Main statistical findings
Headline indicator
GDP per capita
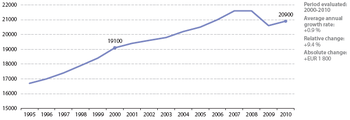
Between 2000 and 2010 real GDP per capita grew in the EU. The 2007 peak in economic growth was followed by a decline in 2009 and slow growth in 2010
Commentary
As a result of the crisis, real GDP per capita fell close to the 2005 level in 2009; despite recovery it had not returned to the pre-crisis level by 2010
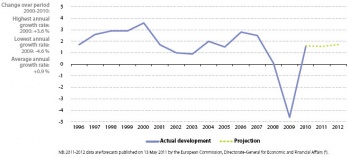
Real gross domestic product (GDP) per capita grew in every year from 2000 to 2007 until the impact of the global economic and financial crisis began to be felt in 2008. The growth of GDP per capita is a measure of the dynamism of an economy and its capacity to create new jobs. It reflects the phases of the economic cycle. After the economic peak of 2000, GDP per capita grew rather slowly during the economic downturn between 2000 and 2003. This was followed by a period of higher growth rates until 2007. However, with the onset of the crisis, GDP per capita grew by only 0.1 % in 2008 and fell by -4.6 % in 2009 down to a level similar to that of 2005. GDP per capita grew by 1.6 % in 2010, and short-term statistics show 2.2 % growth of GDP in the first quarter of 2011 as compared with the same quarter of the previous year, but only 1.7 % in the second quarter [1].
Financial crisis has hit particularly fast-growing eastern European Member States
Some countries were hit harder by the economic crisis than others. A large slump in per capita GDP occurred especially in high-growth countries dependent on exports (mostly eastern European Member States whose economic output is expected to ‘catch up’ with that of the more developed Member States). GDP contraction in most western European Members States extended over four or five quarters before growth resumed. The picture has been more varied in eastern European Member States. Particularly affected by the crisis in terms of GDP per capita were Latvia (with the previous GDP per capita growth rate between 2000 and 2007 being 9.4 % on average), Estonia (8.8 %), Ireland (4.1 %), Lithuania (8.1 %) and Finland (3.2 %). However, some eastern European countries (in particular Poland, Bulgaria, Slovakia and Romania) were hit less severely, due in part to lower current account deficits and external debts at the start of the crisis, stricter banking policies, lower dependence on stock exchange performance and exports, more stable domestic demand and modest exchange rate depreciation (in Member States outside the Euro area). A moderate recovery began in 2010 for most EU countries, with the exception of Greece, Ireland, Latvia, Romania and Spain.
GDP per capita varies widely across the EU
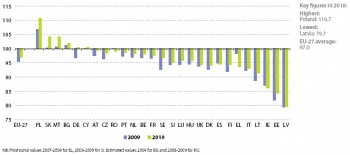
In 2009, GDP per capita in the EU still varied widely between Member States. Among the countries with GDP per capita, in terms of purchasing power standards (PPS)[2]. higher than the EU average are Luxembourg (by 171 %)[3], Ireland (by 27 %), Netherlands (by 31 %), Austria (by 24 %), Denmark (by 21 %) and Sweden (by 18 %). The countries with the lowest are Bulgaria (lower than the EU average by 56 %, Romania (by 54 %), Latvia (by 48 %) and Lithuania (by 45 %) [4].
Economic development
Investment
Between 2000 and 2008 the share of investment in the GDP of the EU followed the economic cycle, resulting in a moderate increase, in particular since 2004, but in 2008 and in 2009 development declined
Commentary
Business investment has been the main influence on total investment
Investment spending is typically a cyclical and volatile component of GDP growth. During the economic downturn of 2000 to 2003, total investment in GDP fell to a low of 19.9 %, mainly due to a decline in business investment. Since 2003 total investment spending rose steadily, above the growth rate of GDP, as a result of the strong economy fuelling business spending. This led to an investment rate of 21.7 % in 2007, which was higher than in the previous cyclical peak of 2000. Throughout this period the share of public investment in GDP remained relatively stable at around 2.4 %. It was mainly business investment that has influenced total investment.
In 2008–2009, the crisis’ effects were visible on falling business and household investment spending
As a result of the economic crisis, spending (including inventories) fell during 2008 and 2009. In 2009, the level of 19.4 % was lower than the trough experienced during the previous cyclical low of 19.9 % in 2003. This was mainly a result of sharp cuts in business investment spending (from 12.4 % in 2008 to 10.9 % in 2009) [5], as well as a slight decrease in household investment spending (from 6.7 % in 2007 to 5.6 % in 2009). Government investment spending grew continuously from 2005 by about 6.5 % annually and this development has not been affected by the economic crisis. In fact, in 2008 and 2009 governments around the world reacted with massive economic stimulus packages to effect a turnaround in the world business cycle (in the EU the European Economic Recovery Plan provided an immediate stimulus package amounting to 1.5 % of EU GDP). Nevertheless, some countries with vital business sectors not severely affected by the economic crisis (in particular Austria, Belgium and Slovakia) managed to keep total investment spending above the EU average even with low levels of government investment.
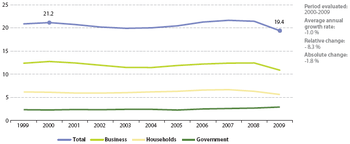
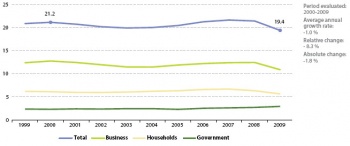
- Modest changes in investment rate reflect fluctuations in business investment
During the economic downturn of 2000 to 2003, the share of total investment in GDP fell to a low of 19.4 %, due to the slower development of business investment. Since 2003, total investment spending has been steadily rising at a higher rate than GDP as a consequence of expanded business spending fuelled by favourable economic conditions, resulting in an investment rate of 21.3 % in 2007. This amount is 0.7 percentage points higher than in the previous cyclical peak of 2000. As the share of public investment in GDP has remained stable since 2000 at around 2.4 %, it is mainly business investment which has made the difference in influencing total investment.
- Stimulus packages to restore confidence
Not surprisingly, in the light of the current economic crisis and because investment spending is typically a strongly cyclical and volatile component of GDP growth, forecasts for the next years show a considerable cutback in total investment down to 19 % of GDP in 2010. Despite the considerable uncertainty in these forecasts, the projection for 2009 is supported by recent data which show a sharp decline of 10.7 % of seasonally adjusted gross investment in the first quarter of 2009 compared to the previous year (10). In order to anti-cyclically compensate for the foreseeable decline in business investment, cohesion policy, which is aimed at strengthening public investment, especially in the economically least-developed regions (11), has been re-emphasised in the European Economic Recovery Plan. Cohesion policy is planned to account for almost 6 % of expected GDP on average over the period 2007 to 2013. The envisaged measures are intended to stimulate private investment and consumption by restoring business and consumer confidence in the economy.
Regional disparities in GDP
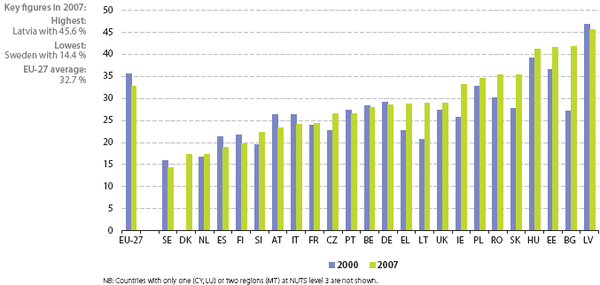
Between 2000 and 2007 disparities in GDP per capita between the regions of the EU decreased, indicating that economic wealth is becoming more equally distributed
Commentary
Disparities in GDP between regions have fallen
Within-country dispersion rates of regional GDP in the EU, which is a measure of the equality of distribution of economic activity among a country’s regions, fell between 2000 and 2007 from 35.5 % to 32.7 % [6].

Dispersion of regional GDP is highest in eastern European countries
In 2007, most countries with disparities higher than the EU average were eastern European. The rapid transition into market economies has apparently led to a polarisation of economic output and an uneven distribution of wealth between regions. Between 2000 and 2007, the within-country dispersion rate of regional GDP rose in 15 out of 24 Member States. Despite growing regional disparities in many countries, the decrease at EU level is likely to be due to declines in Member States with large populations (Spain, Italy and Germany).
Although the indicator presented here refers to NUTS level 3; the trends between 2000 and 2007 are consistent for both NUTS levels 2 and 3.
Household saving
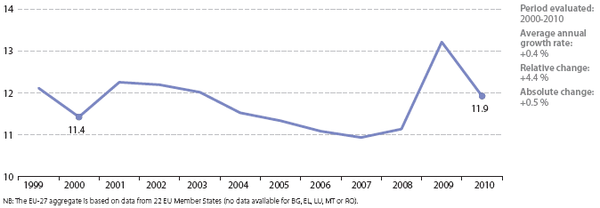
Between 2000 and 2010 the share of saving in the disposable income of EU households increased slightly. Although the rate fell between 2001 and 2007, it improved sharply during the economic crisis in 2008 and 2009 and in 2010 fell close to 2003 level
Economic crisis has manifested in a sharp increase in household saving rate
Commentary
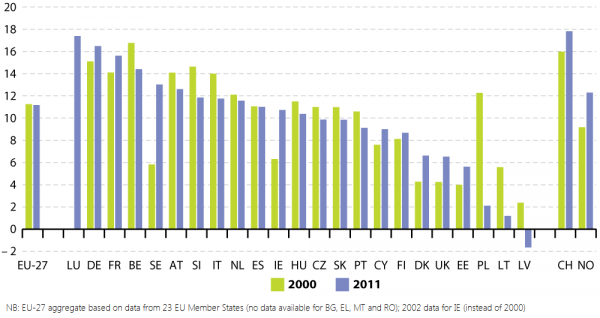
In response to the economic downturn over the years 2001 to 2003, the household saving rate climbed to 12.3 % in 2001 and then fell modestly during the economic upturn until 2007, when it reached a low of 10.9 %. It started to rise again in 2008 and rose sharply during the crisis year of 2009 to 13.2 %. Such sharp increases reflect a lack of confidence by households in the immediate future of the economy and an attempt to protect their long-term assets in view of low interest rates. This was especially the case during the economic crisis when the real disposable income of households decreased [7]. The fall of the household saving rate in 2010 fits the expectation that it will not continue to rise further and will most probably gradually return to pre-crisis levels [8]
Between 2000 and 2009, the household saving rate varied significantly across EU Member States. As can be seen in Figure 1.9, particularly in Baltic countries and the UK, the average household saving rate was very low (less than half the EU average). Numerous factors can help explain country differences in household saving rate, such as income taxes, inflation, the pension system, stock and housing prices, real interest rate, female employment rate or the volume of shadow activities. In 2009, the saving rate across EU Member States ranged from around 6 % (6 % in UK, 7.9 % in Lithuania) to above 18 % (18.1 % in Spain, 18.3 % in Belgium).
Innovation, competitiveness and eco-efficiency
Labour productivity
Between 2000 and 2010 labour productivity in the EU improved, although the economic crisis in 2008 and 2009 reversed this trend, the levels of 2007 were reached in 2010

- After several years of growth, labour productivity in the EU fell in 2008 and 2009, the levels of 2007 were reached in 2010
- Eastern European countries experienced high labour productivity gains in 2000-2010
Labour productivity in the EU rose steadily between 2000 and 2007. In 2007, it began to fall in Denmark, France and Sweden, even if it continued to grow in Bulgaria, Estonia, Ireland, Spain, Cyprus, Slovakia, Portugal and Poland. Falls in productivity during the economic crisis were mostly the result of firms not laying off workers as much as expected (as a result of labour hoarding and strengthened shortterm employment protection legislation in many Member States reducing labour market flexibility and resulting in work-sharing and reducing working hours per worker instead of layoffs) but also slower capital accumulation [9]. However, the economic upturn of 2003 to 2007 has not led to above average increases in labour productivity growth. This can be explained by factors such as declining investment per employee, slowdown in the rate of technological progress, sluggish reorientation of the economy toward sectors with high productivity, the relatively small size of the EU’s information and communication technology industry [10] and a stagnating share of R&D expenditure in GDP (see indicator on ‘R&D expenditure’).
Between 2000 and 2010, labour productivity grew sharply in Member States that were in the process of economic transition and with high GDP growth rates: Romania (74.7 %), Latvia (65.2 %), Slovakia (55.8 %), Estonia (60.1 %), Lithuania (56.6 %), Poland (35.0 %) and Hungary (32.6 %).
- Cross-country differences remain
The growth rate in EU-27 labour productivity has fallen from 2.2 % in 2003 to 1.1 % in 2007. This has been largely due to a decline in the previously high growth rates of eastern European countries.
The slowdown in labour productivity growth between 2003 and 2007, during an economic upswing, might be explained by many factors, such as declining investment per employee, slowdown in the rate of technological progress, sluggish reorientation of the economy toward sectors with high productivity, a relatively small size of the EU’s information and communication technology industry [11]and, not the least, a stagnating share of R & D expenditure in GDP (see indicator on ‘R & D expenditure’). Despite some convergence of labour productivity growth rates over these five years, which was primarily driven by the slow-down in catching up of Member States in the eastern part of the EU, large differences between countries remain. In 2007, there were six countries with growth rates higher than 4 %.
Even though an EU-27 aggregate for 2008 is not yet available at the moment, several Member States’ growth rates sharply declined. Furthermore, out of 14 Member States which have already produced growth figures, nine have negative growth rates. At this stage it is too early to draw firm conclusions, but this negative trend may be explained by the economic crisis.
Research and development expenditure
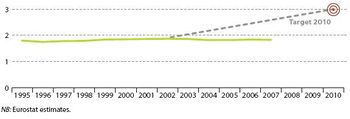
EU spending on research and development remains far from the target value of 3 % of GDP in 2010
- R & D expenditure far from target path
The share of R & D spending as a percentage of GDP remained at about 1.8 % over the period 2000 to 2007. R & D expenditure has thus made no significant progress towards the target of 3 % of GDP set for 2010. At 1.85 % in 2007, this share is below the OECD average of 2.3 %; and both the USA and Japan (at 2.3 % and 2.1 % respectively) devote higher shares of their budgets to R & D (2006 data).
Although most Member States have set national targets, these are rarely translated into budgetary reality, and only Finland and Sweden exceed the 3 % target. In 2007, as in the past, Sweden led with a share of 3.6 % which also gives it a high ranking globally. It was closely followed by Finland with 3.5 %. Austria, Denmark and Germany stood at about 2.5 %. However while Denmark and Germany have only made marginal increases in R & D spending, Austria, on the other hand, increased it spending relative to GDP by 0.6 percentage points. It is Estonia which raised its share the most from 0.6 % to 1.1 % and the largest decline took place in Slovakia where R&D budget was reduced by 0.2 percentage points from 2000 to 2007. Besides Slovakia eight other Member States decreased their contribution over this period.
Energy intensity
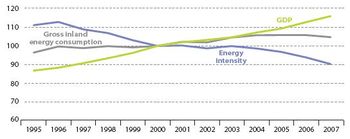
The energy intensity of the EU-27 economy decreased significantly between 2000 and 2007 and the target of 1 % annual reduction in energy intensity has been achieved
- Energy intensity development shaped by economic growth
- Decrease since 2000 sufficient to meet target
The development of energy intensity shows a strong link to the economic cycle: It decreased from 1996 to 2000, remained constant from 2000 to 2003, and further decreased from 2003 to 2007.
Viewed in more detail, between 1995 and 2000 gross inland energy consumption grew at an average rate of 0.7 % per year, much slower than the GDP increase of 2.9 % per year on average. As a result, energy intensity decreased by 2.1 % per year on average in that period. Since 2000, gross inland energy consumption continued to increase by an average of 0.7 % per year, whilst GDP rose at an average rate of 2.2 % between 2000 and 2007. This resulted in a reduction of energy intensity of 1.5 % per year on average. Although interrupted by the economic downswing from 2000 to 2003 the overall decline in energy intensity has been sufficient to meet the target of 1 % reduction per year on average.
Employment
Employment

With the exception of a slight decline in 2002, employment rates increased in the EU-27 over the last decade. However, the interim target of 67 % by 2005 was not reached and annual average growth of the indicator would need to speed up considerably to meet the EU target of 70 % by 2010
- Employment rate follows economic cycle with a time lag
Between 2000 and 2008, the employment rate in EU-27 rose by 3.7 percentage points from 62.2 % to 65.9 %, but remains three years behind the linear target path. The steady increase was interrupted only in 2002 in response to a slowdown of investment at that time (see indicator on ‘Investment’). The annual increase in the employment rate remained comparatively low until the economy recovered in 2004 and its growth was insufficient to reach the intermediate employment target of 67 % in 2005. Differences between EU Member States are sizeable, with employment rates ranging in 2008 from 55.2 % for Malta to 78.1 % in Denmark.
- Crisis may put 70 % target out of reach
If the employment rate continues to rise at the average annual rate of change so far (0.46 percentage points per year between 2000 and 2008), the 70 % target set for 2010 is unlikely to be met. Achieving this target in time would require an average annual increase of 2.05 percentage points in 2009 and 2010. This does not seem feasible given the current economic crisis, which has already led to a decrease in employment rate in the EU-27 for the last two quarters of 2008 and for the first quarter of 2009.
- Education is an important determinant of employment
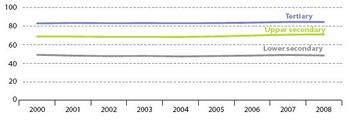
The figure "Employment rate, by highest level of education attained" below shows that the employment rate is the greater the higher the level of education attained. In 2007, more than four-fifths of 25 to 64 year olds with a tertiary level educational qualification were employed, but less than half of persons with lower secondary education. The employment rates within the three analysed education subgroups have remained almost constant over time. It is therefore likely that the increase of employment is at least partially due to shifts from lower to higher education.
Female employment
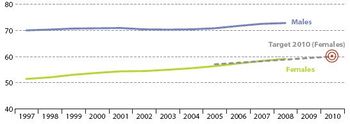
The gap between male and female employment continues to shrink. As a result the rate of female employment is well on track towards the target of 60 % female employment by 2010
- Convergence to male employment strongest in economic upswing
Over the period from 2000 to 2008, female employment rose continuously, shrinking the distance from male employment. Interestingly, this convergence was stronger during 2005 to 2007, which were years of economic upturn, than when economic conditions were less favourable (2000 to 2003 and since 2008). In 2008, the female employment rate was 59.1 %, which was the second consecutive year above the theoretical linear target path. By 2008, 15 Member States had already exceeded the 60 % female employment target. Nevertheless, considerable differences remain among Member States with rates varying between 37.4 % and 74.3 %.
Regional disparities in employment
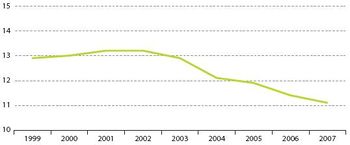
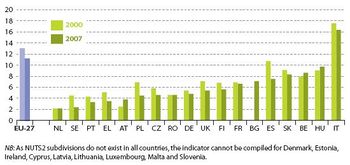
The dispersion of regional employment rates fell by nearly 2 percentage points between 2000 and 2007
- Reduction of regional disparities falls together with economic upturn
The dispersion of regional employment grew slowly between 1999 and 2003 and then steadily decreased over the period from 2003 to 2007, which was characterized by favourable economic conditions. In 2007 the indicator stood at 11.1 %, which was 1.9 percentage points lower than in 2000. Over that period disparities were reduced in 12 of the 18 EU countries for which the indicator can be computed. In 2007, 17 of 18 Member States report dispersion of regional employment rates within their territories below the dispersion within the EU as a whole.
Unemployment
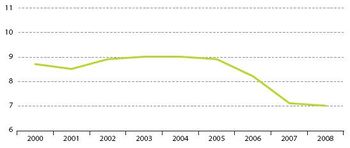
In line with the economic upturn, overall EU unemployment decreased between 2004 and 2008 and reached a lower level than in the previous economic cycle. Age and gender disparities were reduced, but they remain important issues of European social cohesion
- Unemployment follows economic cycle with a time lag
Unemployment increased between 2001 and 2003 from 8.5 % to 9.0 %, lagging one year behind the economic downturn. No change was then observed for several years until it fell in 2006 and 2007 to slightly above 7 %. This level, which was maintained under the less favourable conditions of 2008, was well below the minimum attained over the previous economic cycle. However, in 2008 unemployment increased in 10 Member States, and the latest short-term figures for 2009 indicate that the EU unemployment rate has increased sharply (up to 8.6 % in April 2009) due to the effects of the economic crisis [12].
- Young persons, women and low-skilled people hit most from unemployment
Figures on unemployment by age group and gender show that the labour market situation is worst for young people (aged 15 to 24). In 2008, 15.4 % of economically active persons in that age group were unemployed. This share is twice as high as in the population as a whole. The unemployment rate also considerably differs between countries, ranging from 3 to 11 % in 2008.
- Female unemployment less affected by economic crisis
In the EU-27 the unemployment rate of women favourably decreased by 2.3 percentage points from 9.8 % in 2000 to 7.5 % in 2008, but it still remains 1.1 percentage points higher than that of men. While male unemployment remained stable in 2008, female unemployment appeared to be less affected by the economic crisis and continued to decrease. However, the latest figures for female unemployment also show a sharp increase up to 8.3 % in March 2009.
Further information
Publications
Database
- Indicators
- Socioeconomic Development
Dedicated section
Other information
- A European Economic Recovery Plan (EERP), Commission communication COM(2008) 800 final
- A Shared Commitment for Employment, Commission communication COM(2009) 257 final
- Cohesion Policy: investing in the real economy, Commission communication COM(2008) 876 final 1
- European Competitiveness Report 2008, Commission communication COM(2008) 774 final; [SEC(2008)2853]
- Implementation Report for the Community Lisbon Programme 2008 - 2010, Commission communication COM(2008) 881 final 1
- Progress report on the European Union Sustainable Development Strategy 2007, Commission staff working document SEC (2007) 1416
- Progress Report on the Sustainable Development Strategy 2007, COM(2007) Commission communication 642 final;[SEC(2007)1416]
See also
Notes
- ↑ Eurostat news release, Euro-indicators 118/2011, Euro area and EU27 GDP up by 0.2%, 16 August 2011
- ↑ The Purchasing Power Standard (PPS) is an artificial reference currency unit that eliminates price level differences between countries. One PPS buys the same volume of goods and services in all countries. This unit allows meaningful volume comparisons of economic indicators across countries. Aggregates expressed in PPS are derived by dividing aggregates in current prices and national currency by the respective Purchasing Power Parity (PPP). The level of uncertainty associated with the basic price and national accounts data, and the methods used for compiling PPPs imply that differences between countries that have indexes within a close range should be interpreted with care
- ↑ The high level of GDP per capita in Luxembourg is partly due to the large share of cross-border workers in total employment. While contributing to GDP, they are not taken into consideration as part of the resident population which is used to calculate GDP per capita
- ↑ See the Structural Indicator ‘GDP per capita in PPS’ tsieb010on the Eurostat website.
- ↑ Worldwide, business investment spending started recovering about mid-2010. However, a slower recovery is predicted for the EU than Japan and USA. See for example Eurostat news release, Euro-indicators 161/2010, Business investment rate up to 20.4 % in the euro area and 19.9 % in the EU27, 28 October 2010 and OECD Factblog, Business returns, 19 November 2010.
- ↑ Regional disparities of GDP will probably have been negatively affected by the economic crisis of 2008 and 2009
- ↑ Household real disposable income started to fall in some countries already in the first quarter of 2008 and has continued to fall until 2010. The reason was that nominal incomes of households fell slightly, mostly due to rising unemployment, and the prices of goods and services they consume grew. See also Eurostat news release, Euro-indicators 111/2010, Household saving rate down to 14.6% in the euro area and 13.0% in the EU27, 29 July 2010 and Eurostat news release, Euro-indicators 14/2011, Household saving rate down to 13.8% in the euro area and 11.5% in the EU27, 28 January 2011.
- ↑ Commission staff working document, European economic forecast – autumn 2009, European Economy 10/2009.
- ↑ European economic forecast – autumn 2010, ibid.
- ↑ Commission communication, Second Implementation Report on the 2003-2005 BEPGs, COM(2005) 8; Timmer, M.P. and van Ark, B., ‘Does information and communication technology drive productivity growth differentials? A comparison of the European Union countries and the United States’, Oxford Economic Papers, 57(4), 2005, pp. 693-716.
- ↑ Commission Communication, Second Implementation Report on the 2003-2005 BEPGs, COM(2005) 8; Timmer, M.P. and van Ark, B., 'Does information and communication technology drive productivity growth differentials? A comparison of the European Union countries and the United States', Oxford Economic Papers, 57(4), 2005, pp. 693-716 [1]
- ↑ Eurostat news release, Euro-indicators 79/2009, Euro area unemployment up to 9.2%, 2 June 2009
