.png)
.png&body=Statistics Explained - Evolution of the value of sold production for top 5 manufacturing activities, EU, 2013-2023 (2021=100).png %0A https%3A%2F%2Fec.europa.eu%2Feurostat%2Fstatistics-explained%2Findex.php%3Ftitle%3DFile%3AEvolution_of_the_value_of_sold_production_for_top_5_manufacturing_activities%2C_EU%2C_2013-2023_%282021%253D100%29.png)
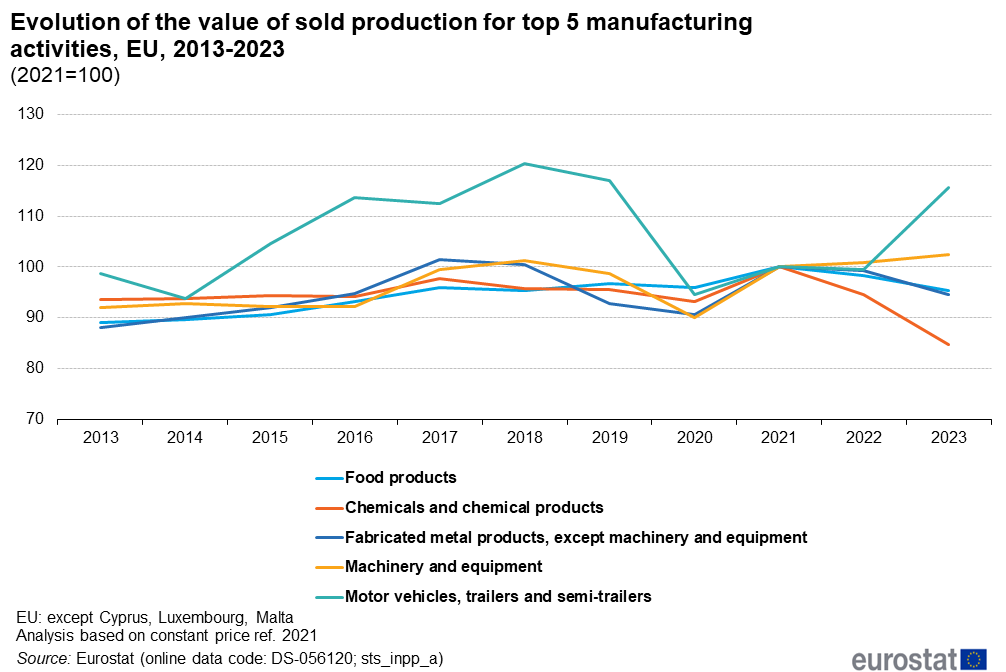
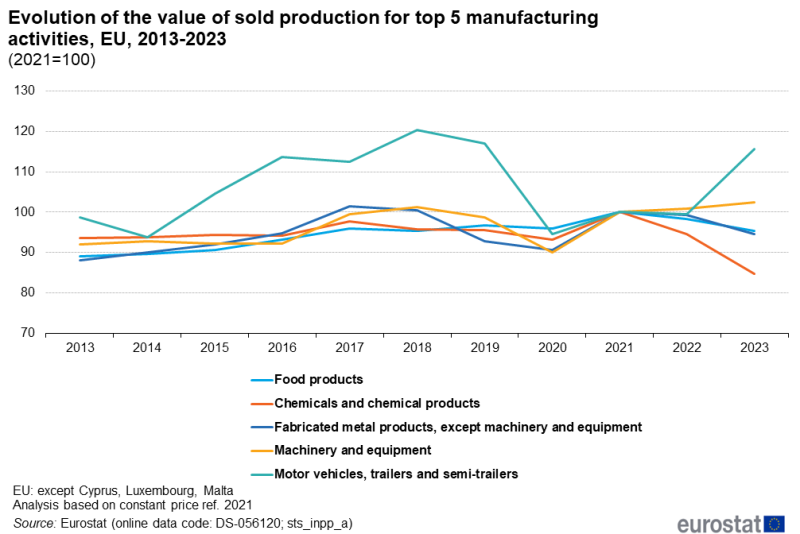
File:Evolution of the value of sold production for top 5 manufacturing activities, EU, 2013-2023 (2021=100).png
Size of this preview: 800 × 534 pixels. Other resolutions: 320 × 214 pixels | 1,006 × 672 pixels.
Original file (1,006 × 672 pixels, file size: 46 KB, MIME type: image/png)
File usage
There are no pages that use this file.
.png&oldid=646127)
.png)
.png&action=edit&redlink=1)
.png&action=history)