Businesses in the computer and personal and household goods repair sector
Data from July 2024
Planned article update: June 2025
Highlights
The sector for the repair of computers and personal and household goods employed 341 000 persons in the EU in 2021.
The sector for the repair of computers and personal and household goods accounted for 0.6% of the total number of enterprises in the EU in 2021.
This article presents an overview of statistics for the repair of computers and personal and household goods in the European Union (EU), as covered by NACE Rev. 2 Division 95. This and Other personal service activities (NACE division S96) are the only divisions within Section S (other service activities) for which structural business statistics (SBS) are compiled and these divisions complete the SBS coverage of the business economy which is defined as Sections B to N and P to R, as well as Divisions S95 and S96. This article belongs to a set of statistical articles on 'Business economy by sector'.
Full article
Structural profile
There were around 196 700 enterprises operating with the repair of computers and personal and household goods (Division 95) as their main activity in the EU in 2021, an increase of 5.2% compared to the previous year. Together they employed 0.7% more than in 2020, accounting for almost 340 900 persons. This is equivalent to 0.2% of the business economy employment. They generated only 0.1% of the business economy total, accounting for €8.9 billion of value added, an increase of 14.2% compared to the previous year.
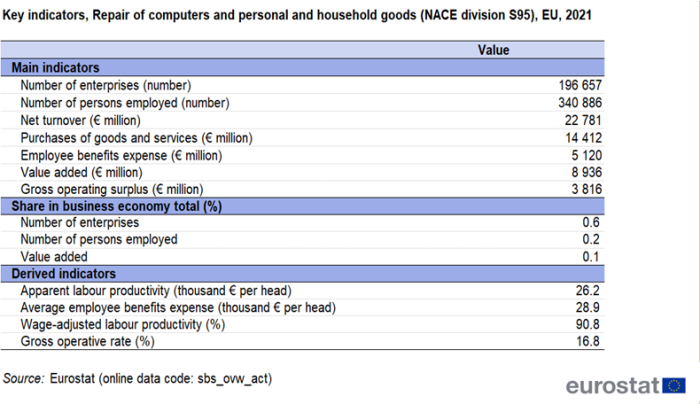
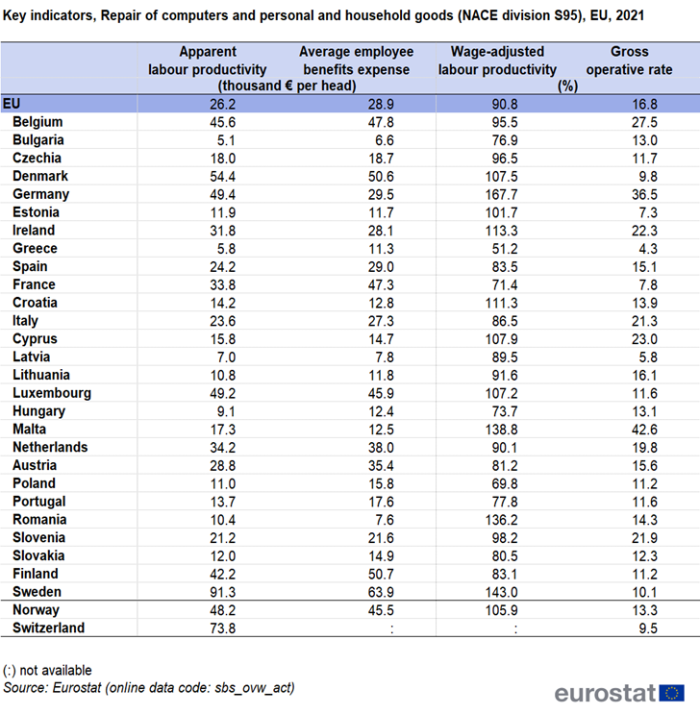
Apparent labour productivity of the EU’s repair of computers and personal and household goods sector in 2021 was €26 200 per person employed, which was well below the business economy average of €60 200 per person employed and third smallest among all NACE sections that constitute the business economy, after accommodation and food service activities sector (NACE Section I) and other personal services activities (NACE Section S96). The repair of computers and personal and household goods sector is characterized as a labour-intensive activity. Despite very low apparent labour productivity , the EU’s average employee benefit expense for the repair of computers and personal and household goods sector were more than 26% below the business economy average: €28 900 per employee for the repair of computers and personal and household goods compared with €39 000 per employee.
The wage-adjusted labour productivity ratio combines the two previous indicators and shows the extent to which value added per person employed covers average employee benefit expense per employee. The particularly low apparent labour productivity for the repair of computers and personal and household goods sector was below the corresponding level for average employee benefit expense in 2021, resulting in a wage-adjusted labour productivity ratio below parity (90.8%). As such, the repair of computers and personal and household goods sector had a lower wage-adjusted labour productivity than any of the NACE sections within the business economy, while the wage-adjusted labour productivity average business economy was 154.4%.
The gross operating rate (the relation between the gross operating surplus and turnover) is a measure of profitability. The gross operating rate for the EU’s repair of computers and personal and household goods sector in 2021 stood at 16.9%, which was above the business economy average (13.2%). This relatively high gross operating rate is achieved as a result of relatively low levels of turnover compared with value added, as well as comparatively low personnel cost — a pattern that is typical of many labour-intensive service activities (other than distributive trades).
Sectoral analysis
Over two thirds (74.8%) of the enterprises within the EU’s repair of computers and personal and household goods sector were classified to the repair of personal and household goods (Group 95.2) in 2021, with the remainder repairing computers and communication equipment (Group 95.1). The repair of personal and household goods subsector was also largest in terms of employment, accounting for 65.9% of the sectoral employment in 2021, and generated 54.8% of the total turnover. The more technical activity of the repair of computers and communication equipment subsector recorded a slightly higher share of employee benefit expense, at 52.0% of the total. The two subsectors show large variations in the contribution to the performance of the overall sector, depending on the derived indicators concerning employee benefit expense, productivity and profitability.

(% share of sectoral total) - Source: Eurostat (sbs_ovw_act)
The low apparent labour productivity figure for the whole of the EU’s repair of computers and personal and household goods sector (€26 200 per person employed in 2021) was pulled downwards by the subsector for the repair of personal and household goods which recorded only €21 800 of value added per person employed (in 2021) in contrast to €34 700 per person employed recorded for the repair of computers and communication equipment in 2021. The former was still less than a half of the business economy average (€60 200). Average employee benefit expense per employee ranged from €33 600 per employee for the repair of computers and communication equipment — just below than the average of €39 000 for the whole of the business economy — to €25 000 per employee for the repair of personal and household goods.


The gross operating rate for the EU’s repair of computers and personal and household goods sector was 16.8% in 2021, which was higher than the average for the whole of the business economy (13.2%). The gross operating rate for the repair of computers and communication equipment (11.9%) was quite close to the average.
Country overview
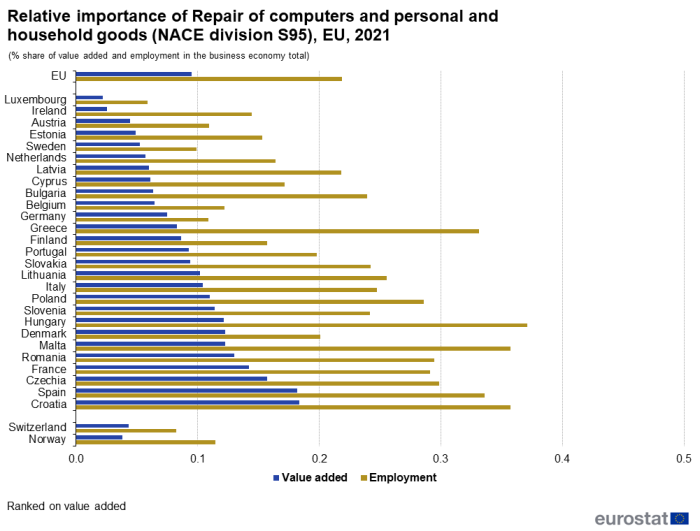
(% share of value added and employment in the business economy total) - Source: Eurostat (sbs_ovw_act)
Germany accounted for almost a quarter (23.1%) of the EU’s value added within the repair of computers and personal and household goods sector in 2021, a considerably greater share than any recorded by the other EU Member States — see Figure 3. It should be noted that even in those countries with the largest repair of computers and personal and household goods sectors, the contribution of this activity to the business economy remained low: for example, in Croatia, Spain, Czechia and France, it accounted for less than 0.2% of business economy value added — the highest shares among any of the Member States. The relative importance of the repair of computers and personal and household goods sector, in terms of the value added, was also low in EFTA countries, standing at 0.04% of the business economy total in Switzerland and Norway.
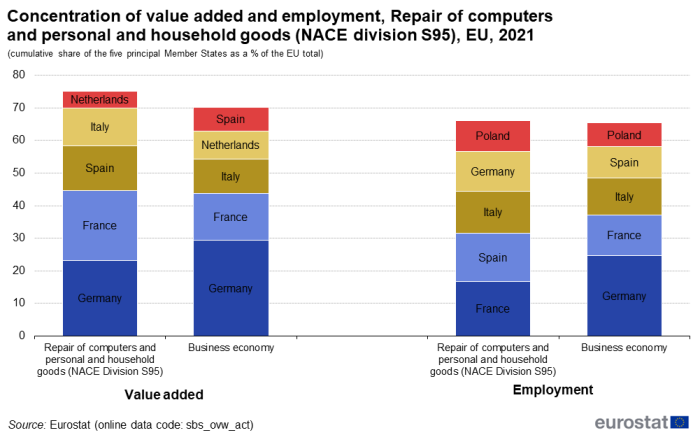
(cumulative share of the five principal Member States as a % of the EU total) - Source: Eurostat (sbs_ovw_act)
In employment terms, the share of the repair of computers and personal and household goods sector in the business economy employment peaked at 0.37% in Hungary and 0.36% in Croatia and Malta, while shares less than 0.15% were recorded for Ireland, Belgium, Austria, Germany, Sweden, Germany and Luxembourg.

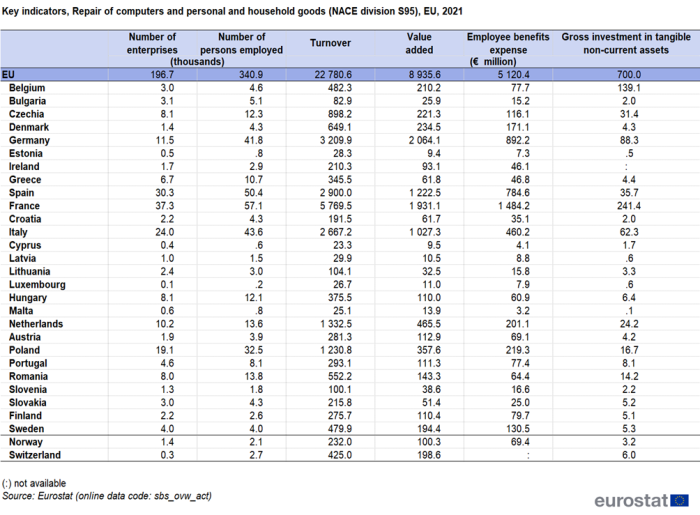
A large majority of EU Member States had a wage-adjusted labour productivity ratio below parity (100.0%) with Greece as the country with lowest record of only (51.2%). A value above the non-financial economy average (154.4%) was recorded only in Germany (167.7%).
Data sources
Coverage
The activities covered by Division 95 which forms the basis of this article are the repair and/or maintenance of:
- computers and computer peripherals such as printers as well as communications equipment like fax machines and mobile phones;
- home electronic goods (consumer electronics); garden equipment; clothing and footwear; furniture and furnishings; personal items such as watches and jewellery; most other consumer goods such as bicycles, toys, sports equipment and musical instruments.
This article does not cover the repair of industrial machinery and equipment, central heating and air conditioning equipment, nor hand-held power tools and it also excludes enterprises that carry out repair as a secondary activity in combination with other activities; as such, it focuses exclusively on specialist repairers.
Data sources
The analysis presented in this article is based on the main dataset for structural business statistics (SBS), size class data and regional data, all of which are published annually.
The main series provides information for each EU Member State as well as a number of non-member countries at a detailed level according to the activity classification NACE. Data are available for a wide range of variables.
In structural business statistics, size classes are generally defined by the number of persons employed. A limited set of the standard structural business statistics variables (for example, the number of enterprises, turnover, persons employed and value added) are analysed by size class, mostly down to the three-digit (group) level of NACE. The main size classes used in this article for presenting the results are:
- small and medium-sized enterprises (SMEs): with 1 to 249 persons employed, further divided into:
- micro enterprises: with less than 10 persons employed;
- small enterprises: with 10 to 49 persons employed;
- medium-sized enterprises: with 50 to 249 persons employed;
- large enterprises: with 250 or more persons employed.
Regional SBS data are available at NUTS levels 1 and 2 for the EU Member States, Iceland and Norway, mostly down to the two-digit (division) level of NACE. The main variable analyzed in this article is the number of persons employed. The type of statistical unit used for regional SBS data is normally the local unit, which is an enterprise or part of an enterprise situated in a geographically identified place. Local units are classified into sectors (by NACE) normally according to their own main activity, but in some EU Member States the activity code is assigned on the basis of the principal activity of the enterprise to which the local unit belongs. The main SBS data series are presented at national level only, and for this national data the statistical unit is the enterprise. It is possible for the principal activity of a local unit to differ from that of the enterprise to which it belongs. Hence, national SBS data from the main series are not necessarily directly comparable with national aggregates compiled from regional SBS.
Context
Enterprises providing services for the repair of computers and communications equipment as their principal activity may provide services directly to end clients such as households and business clients, or they may provide specialised services to intermediaries such as manufacturers or distributors. Enterprises providing repair and maintenance services for personal and household goods are generally focused on household clients.
Business clients with more complex requirements for information technology (IT) services may well receive repair and maintenance services for computers and communications equipment bundled into broader IT services (see the article on information and communication services) provided by information technology services providers (Division 62). Equally, repair and maintenance services may be provided as a secondary activity by enterprises that are principally manufacturers or distributors of computers and communications equipment.
Many repair activities, including those presented in this article — or others, such as those related to motor vehicles — often face increased demand during downturns in the overall economic cycle as households and businesses postpone purchases of new capital goods or consumer durables and semi-durables and repair existing items instead; equally demand for repair services may decrease during an upturn in the cycle.
Direct access to
- Recent Eurostat publications on SBS
- Key figures on Europe – 2023 edition – see subchapter on Business
- Eurostat's Regional Yearbook – see chapter 8. Business
- News Release SBS – 2021 final data
Glossary
ESMS metadata files
- Structural business statistics – SBS metadata file