_NA2024.png)
 NA2024.png&body=Statistics Explained - Gross value added at current basic prices, 2005 and 2023 (% share of total gross value added) NA2024.png %0A https%3A%2F%2Fec.europa.eu%2Feurostat%2Fstatistics-explained%2Findex.php%3Ftitle%3DFile%3AGross_value_added_at_current_basic_prices%2C_2005_and_2023_%28%2525_share_of_total_gross_value_added%29_NA2024.png)
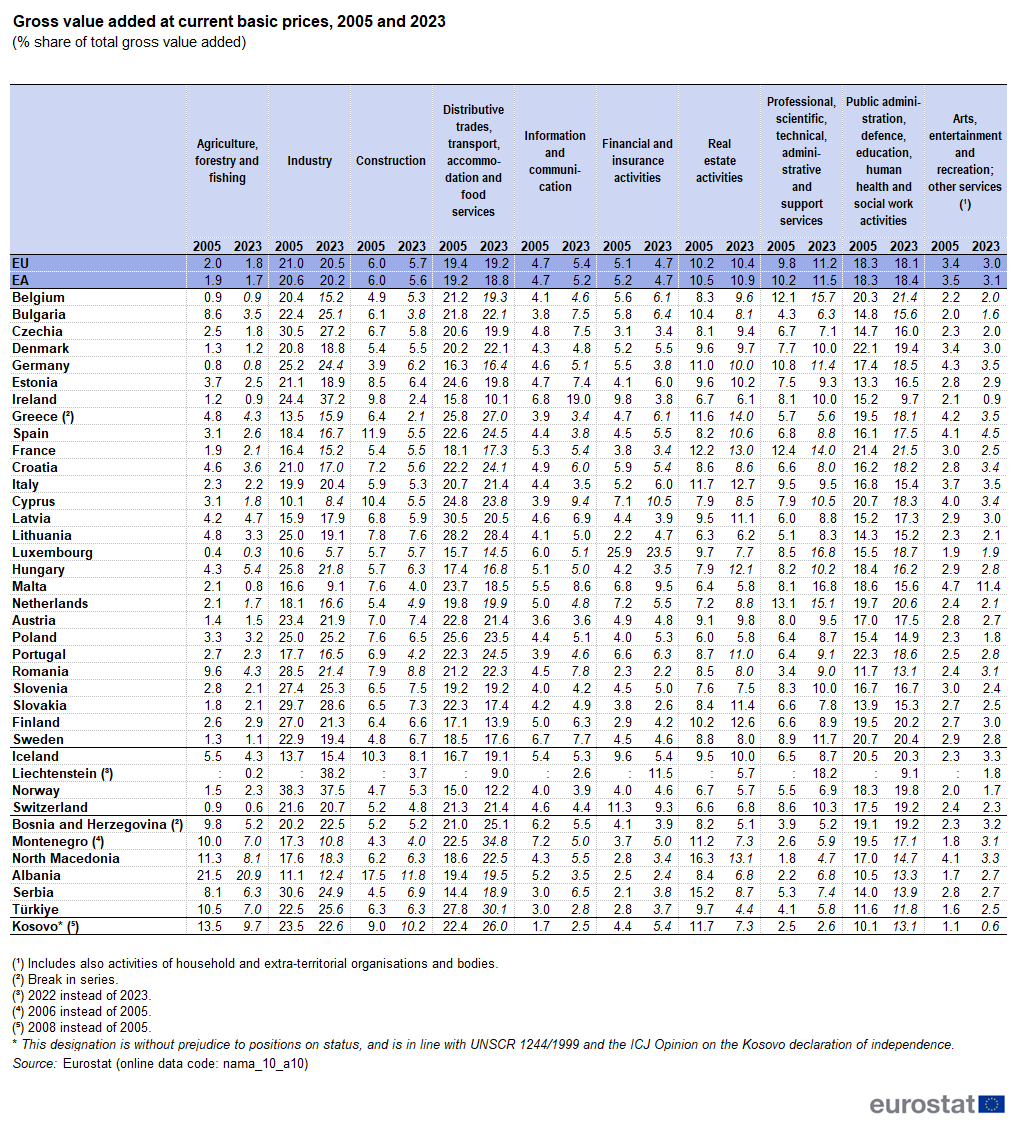
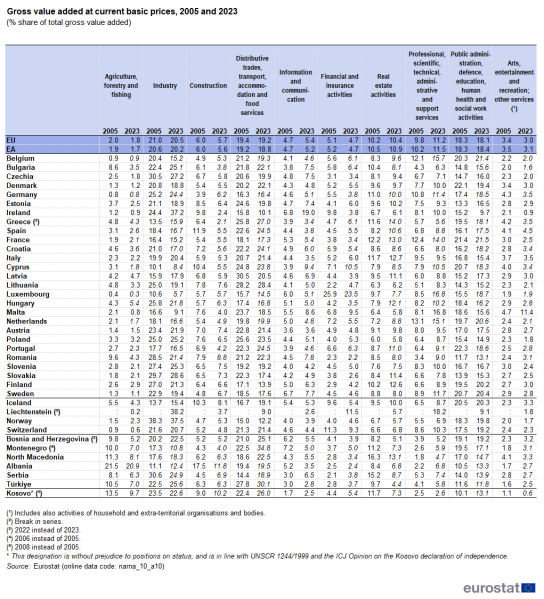
File:Gross value added at current basic prices, 2005 and 2023 (% share of total gross value added) NA2024.png
Size of this preview: 544 × 599 pixels. Other resolutions: 218 × 240 pixels | 1,021 × 1,125 pixels.
Original file (1,021 × 1,125 pixels, file size: 128 KB, MIME type: image/png)
null
File usage
The following page uses this file:
_NA2024.png&oldid=643077)
_NA2024.png)
_NA2024.png&action=edit&redlink=1)
_NA2024.png&action=history)