EU labour market - quarterly statistics
Data extracted in June 2023
Planned article update: 13 September 2024
Highlights
This article presents seasonally adjusted quarterly indicators on employment and labour market slack, which comprises all persons who have an unmet need for employment, including unemployed people. These indicators, taken together, are used to capture the most recent movements on the labour market in the EU countries.
Full article
Employment rate up in the EU
In the first quarter of 2024, 197.3 million persons in the EU were employed. The EU seasonally adjusted employment rate for people aged 20-64 years stood at 75.7 %, up from 75.5 % in the fourth quarter of 2023, as shown in Figure 1.
For the same period, the seasonally adjusted total labour market slack in the EU, which is the unmet need for work, amounted to 24.1 million persons, which represented 11.2 % of the extended labour force in the first quarter of 2024 , stable compared to the fourth quarter of 2023. Regarding its main component, unemployment, 12.2 million persons were unemployed in the first quarter of 2024 and the EU seasonally adjusted unemployment rate was 5.8 % down from 5.9 % in the fourth quarter of 2023. Underemployed part-time workers accounted for 2.4 % of the extended labour force, those available for work but not seeking work accounted for 2.4 % and those actively seeking work but not available to take up work accounted for 0.8 %. These three components of the slack remained stable compared with fourth quarter of 2023. [1]
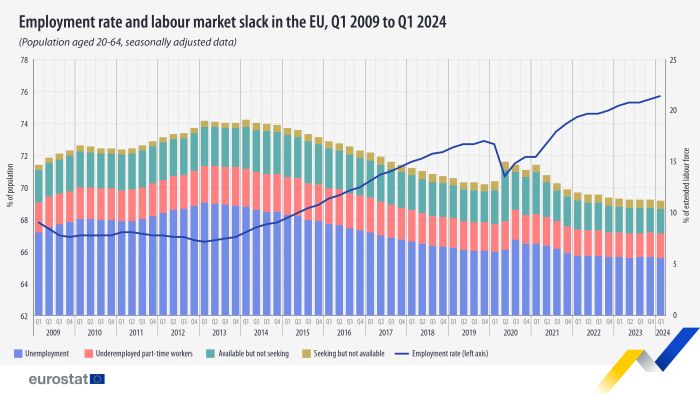
(%)
Source: Eurostat (lfsi_sla_q) and (lfsi_emp_q)
Estonia, Malta, Lithuania and Latvia see the greatest increase in labour market slack
Compared with the fourth quarter of 2023, labour market slack decreased in 12 countries in the first quarter of 2024. It remained stable in Belgium, Czechia, Hungary, Luxembourg and Slovenia and increased in 12 countries. The largest increases were reported in Estonia (+2.0 percentage points (pp)), Malta (+0.8 pp) as well as in Lithuania and Latvia (both +0.6 pp). The employment rate changed between the fourth quarter of 2023 and the first quarter of 2024 across the EU countries, except in Italy and Latvia where it remained stable. The highest increases among the 15 EU countries where employment rose, were registered in Croatia (+1.8 pp), Slovenia (+1.3 pp) and Bulgaria and Greece (both +0.9 pp). The largest decreases were recorded in Estonia, Cyprus and Lithuania (all three, -0.5 pp) and Czechia (-0.4 pp), as shown in Figure 2.
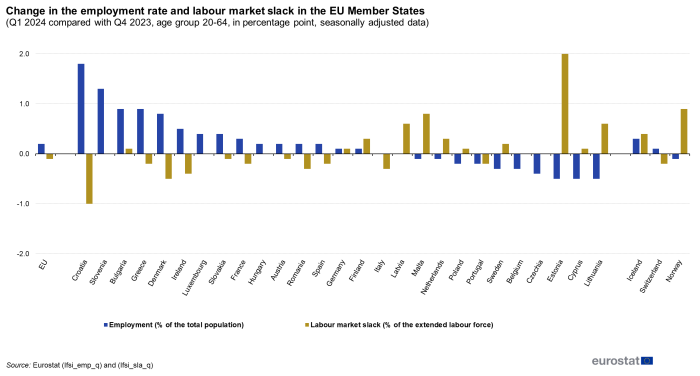
(percentage points)
Source: Eurostat (lfsi_emp_q) and (lfsi_sla_q)
Focus on the gender gap in employment development
When looking at the development of the employment rate, the gender employment gap[2] in the EU decreased by 0.1 pp between the fourth quarter of 2023 and the first quarter of 2024. While the employment rate of women increased by +0.2 pp, the employment rate of men increased by +0.1 pp. The largest changes in gender gaps among EU countries were found in Luxembourg (+2.2 pp due to a decrease of -0.7 pp for women and an increase of +1.5 pp for men), Romania (-2.1 pp due to an increase of +1.2 pp for women and a decrease of -0.9 pp for men), Croatia (-1.7 pp due to an increase of +2.7 pp for women and an increase of 1.0 pp for men), Denmark (+1.4 pp due to an increase of +0.1 pp for women and an increase of +1.5 pp for men) and Finland (-1.4 pp due to a decrease of -0.7 pp for women and an increase of +0.7 pp for men) as shown in Figure 3.
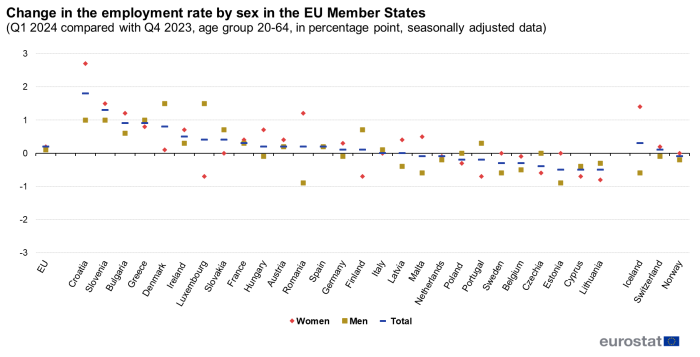
(percentage points)
Source: Eurostat (lfsi_emp_q)
Unemployment in the EU countries
Comparing the fourth quarter of 2023 with the first quarter of 2024, the unemployment rate at EU level decreased from 5.9 % to 5.8 % of the labour force. The highest decreases were registered in Croatia (from 5.1 % to 4.4 %), Denmark (from 5.3 % to 5.0 %) and Romania (from 5.2 % to 4.9 %). The unemployment rate remained unchanged in Czechia, Ireland, Latvia and Hungary while it increased in 12 other countries. The highest increases were observed in Estonia (from 6.3 % to 7.9 %), Lithuania (from 7.3 % to 8.0 %) and Luxembourg (from 4.8 % to 5.4 %) as shown in Figure 4.
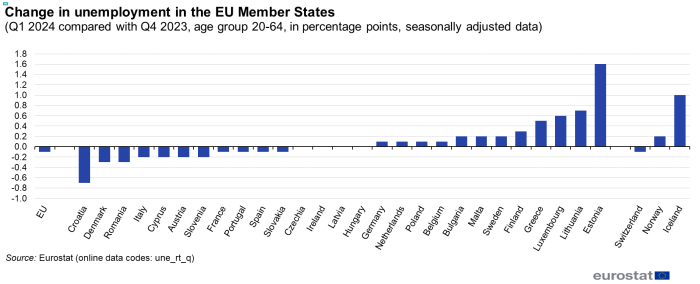
(percentage points)
Source: Eurostat (une_rt_q)
Main indicators
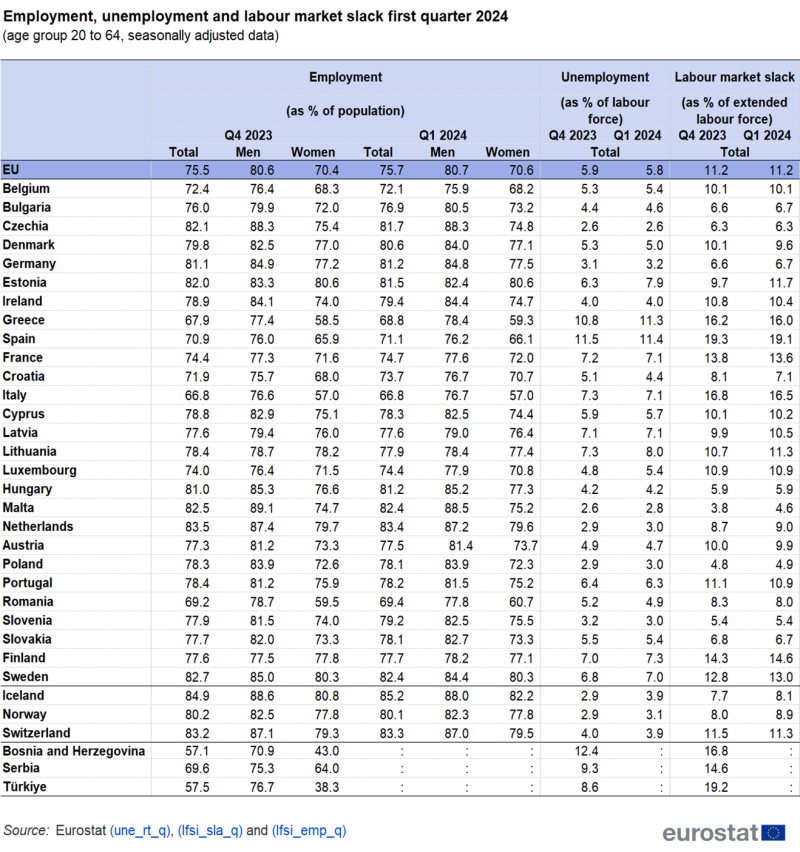
Source: Eurostat (une_rt_q), (lfsi_sla_q) and (lfsi_emp_q)
Source data for tables and graphs
Data sources
All figures in this article are based on seasonally adjusted quarterly results from the European Union Labour Force Survey (EU-LFS). The European Union labour force survey (EU-LFS) is the largest European household sample survey providing quarterly and annual results on labour participation of people aged 15 years and over as well as on persons outside the labour force. It covers residents in private households. Conscripts in military or community service are not included in the results. The EU-LFS is based on the same target populations and uses the same definitions in all countries, which means that the results are comparable between countries.
The labour market indicators published from the first quarter of 2021 are based on the EU Labour Force Survey (EU-LFS) under the Regulation (EU) No 1700/2019 on European statistics relating to persons and households, based on data at individual level collected from samples. Quarterly series for main indicators before 2021 are back-calculated in line with the new methodology up to the first quarter of 2009, see here.
Main methodological information
Country notes:
- The Netherlands collect quarterly LFS data using a rolling reference week instead of a fixed reference week, i.e. interviewed persons are asked about the situation of the week before the interview rather than a pre-selected week.
Methods and definitions:
Eurostat produces harmonised labour market data for individual EU countries, the euro area and the EU. The concepts and definitions used in the Labour Force Survey follow the guidelines of the International Labour Organisation.
Employed persons are all persons who worked at least one hour for pay or profit during the reference week or unpaid for a business owned by a member of the family, or were temporarily absent from such work. The employment rate is the percentage of employed persons in relation to the total population.
The Gender Employment Gap is the difference between the employment rates of men and women aged 20-64 years.
Unemployed persons are all persons who:
- are without work;
- are available to start work within two weeks;
- and have actively sought employment at some time during the previous four weeks.
The labour market slack is the sum of unemployed persons, underemployed part-time workers, persons seeking work but not immediately available and persons available to work but not seeking, expressed as percentage of the extended labour force.
Underemployed part-time workers are persons working part-time who wish to work additional hours and are available to do so. Part-time work is recorded as self-reported by individuals.
Persons seeking work but not immediately available are the sum of persons neither employed nor unemployed who: (a) are actively seeking work during the last four weeks but not available for work in the next two weeks; or (b) found a job to start within a period of at most three months and are not available for work in the next two weeks; or (c) found a job to start in more than three months but are not available for work in the next two weeks.
Persons available to work but not seeking are the sum of persons neither employed nor unemployed who want to work and (a) are available for work in the next two weeks but are not seeking work, or (b) were passively seeking work during the last four weeks and are available for work in the next two weeks or (c) found a job to start in more than three months and are available to work in the next two weeks.
The extended labour force is the total number of people employed plus unemployed, plus those seeking work but not immediately available plus those available to work but not seeking. In this article, data cover persons aged 20 to 64 years.
Direct access to
- New measures of labour market attachment - Statistics in focus 57/2011
- European Union Labour force survey - selection of articles (Statistics Explained)
- LFS main indicators (lfsi)
- Unemployment - LFS adjusted series (une)
- Supplementary indicators to unemployment - annual data (lfsi_sup_a)
- Supplementary indicators to unemployment - quarterly data (lfsi_sup_q)
- Unemployment - LFS adjusted series (une)
- LFS series - Detailed annual survey results (lfsa)
- Total unemployment - LFS series (lfsa_unemp)
- Supplementary indicators to unemployment by sex and age (lfsa_sup_age)
- Supplementary indicators to unemployment by sex and educational attainment level (lfsa_sup_edu)
- Supplementary indicators to unemployment by sex and citizenship (lfsa_sup_nat)
- Total unemployment - LFS series (lfsa_unemp)
- LFS series - Detailed quarterly survey results (lfsq)
- Total unemployment - LFS series (lfsq_unemp)
- Supplementary indicators to unemployment by sex and age (lfsq_sup_age)
- Supplementary indicators to unemployment by sex and educational attainment level (lfsq_sup_edu)
- Total unemployment - LFS series (lfsq_unemp)