Tourism satellite accounts on Europe
Data collected in 2022
Planned article update: December 2025
Highlights
Tourism generated an estimated €572 billion gross value added in 2019, or 4.5 % of the total gross value added in the EU economy.
The highest shares of tourism in a country’s total gross value added was observed in Croatia (11 %).
The COVID-19 pandemic caused a drop in tourism gross value added by €184 billion in 2020 (-32 % compared with 2019), or a daily loss for the sector of around €500 million.
This article introduces the concept of tourism satellite accounts (TSA) as an internationally acknowledged tool to assess the economic importance of tourism, and presents some main statistical findings. Even though TSA have been successfully compiled over the last 25 years in some countries, the statistics presented here are labelled as “experimental” because the EU level data are aggregated based on country components with a different level of development and harmonisation.
Eurostat has been publishing papers on TSA since 2010, the most recent was in April 2023. This article summarises the findings of that paper, as a quick introduction for non-expert readers, in the context of the inclusion of “Tourism Satellite Accounts on Europe” in Eurostat’s set of experimental statistics. The reference year is 2019 because this was the last year before the outbreak of the COVID-19 pandemic and therefore a more representative year for describing the economic importance of tourism.
Full article
What are tourism satellite accounts?
Traditional European tourism statistics, typically collected from service providers in the tourism sector or from households, focus mainly on measuring tourism flows in a country or between countries (number of tourists, number of nights spent, etc.). While these statistics are an essential element for understanding or monitoring tourism in Europe, there is a strong user need to understand the economic dimension of tourism and the sector’s impact on the economy and on the labour market. TSA rely on the concepts of national accounts and can be seen as a ‘satellite’ to the national accounts system, identifying the tourism sector and quantifying its macro-economic importance.
Domestic tourism is dominant in the EU
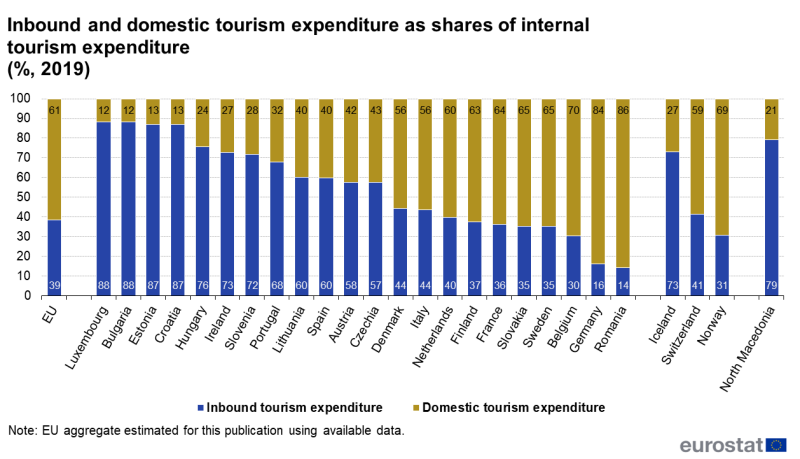
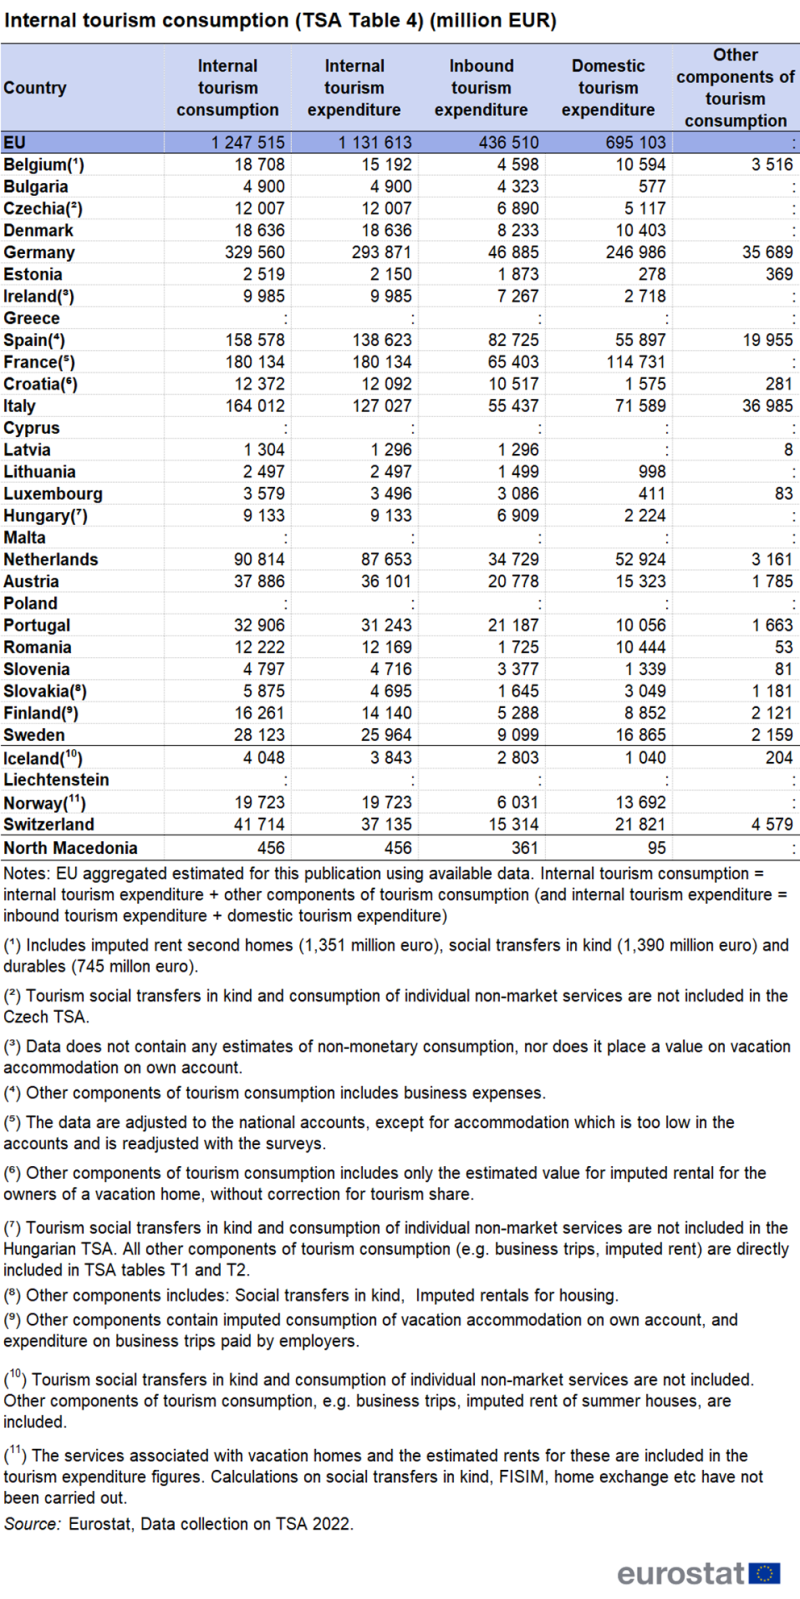
TSA consists of ten tables, of which the first four relate to the demand side, or how much visitors spend. When looking at internal tourism expenditure (expenditure by overnight tourists and same-day visitors in the economy), domestic tourism was the dominant flow. In 2019, visitors making trips in their own country of residence accounted for 61 % of internal tourism expenditure, while inbound tourism (trips made by foreigners) accounted for the remaining 39 %. Not surprisingly, there are big differences across the EU. The importance of domestic tourism in internal tourism expenditure ranged from more than 80 % in Romania and Germany to less than 15 % in Luxembourg, Bulgaria, Estonia and Croatia (see Figure 1 and Table 1, summarising information from TSA Table 4).
Nearly one third of domestic tourism expenditure is generated by same-day visits
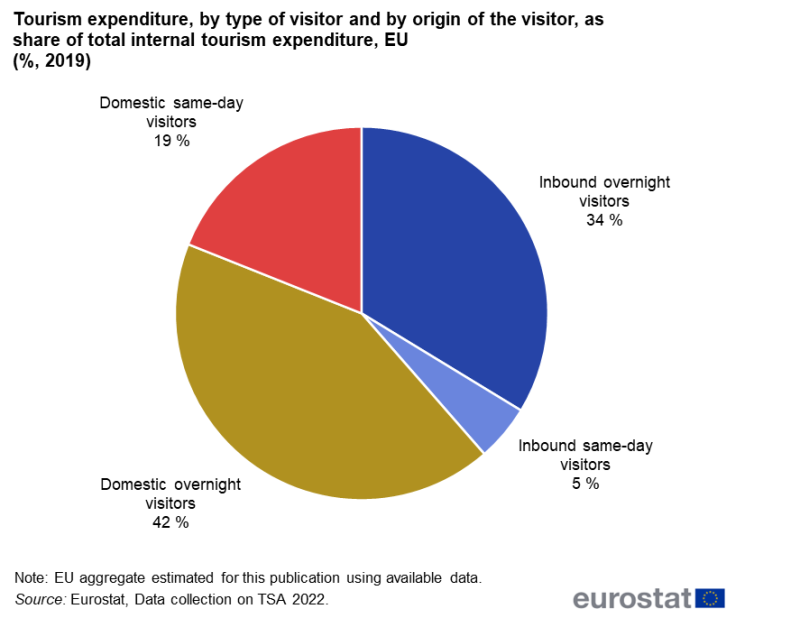
Tourism does not only include trips outside one’s usual environment spending one or more nights away from home, but also comprises same-day visits for tourism purposes. While overnight tourism was the dominant component (76 %) in the internal tourism expenditure in 2019, same-day visitors also make a substantial contribution (24 %). Not surprisingly, the share of same-day visits in inbound tourism expenditure is relatively low (13 %), but their share in domestic tourism expenditure is quite high (31 %).
Tourism accounts for 4.5 % of the total gross value added in the EU economy
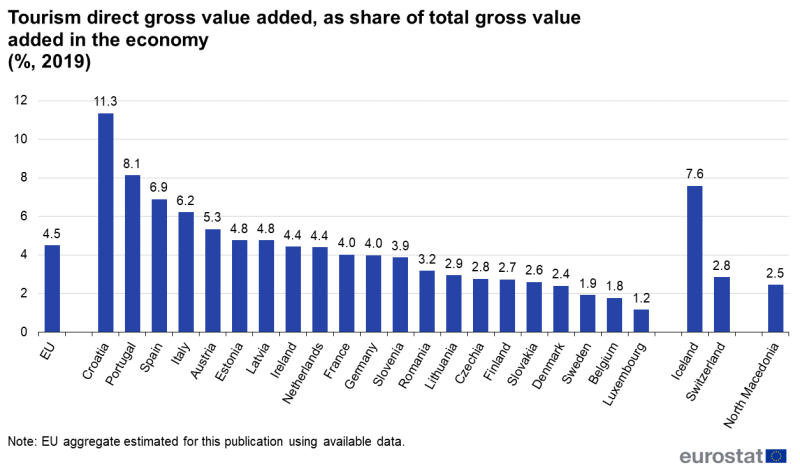
Table 6 of the TSA system consolidates the demand side and the supply side and makes it possible to estimate economic aggregates such as gross value added. Figure 3 shows the share of tourism direct gross value added in the total gross value added in the entire economy, giving an indication of macro-economic importance of tourism. On average for the EU, tourism accounted for 4.5 % of the gross value added created in the EU during 2019, with big variation across the EU: from 11.3 % in Croatia to 1.2 % in Luxembourg.
In absolute value, tourism direct gross value added amounted to €572 billion. The main contributors to this estimate at EU level, were the tourism sector from Germany (€124 billion), Italy (€100 billion), France (€87 billion) and Spain (€78 billion). Note that gross value added is not only created via trips spent in a country, but for instance also by resident service providers (such as airlines or tour operators) that provide tourism services to residents visiting destinations abroad.
The COVID-19 pandemic hit the tourism sector particularly hard
As mentioned in the introduction to this article, the data refers to the year 2019 to reflect the economic importance of tourism in a ‘normal’ year, not affected by an external shock like the COVID-19 pandemic. However, using data available from a subset of countries, this article also takes a look at the impact of the pandemic on the tourism sector.
In 2020, internal tourism consumption in the EU is estimated to have dropped by 45 %, with a stronger drop in inbound expenditure (thus by foreign tourists) than in domestic tourism, respectively -59 % and -32 %.
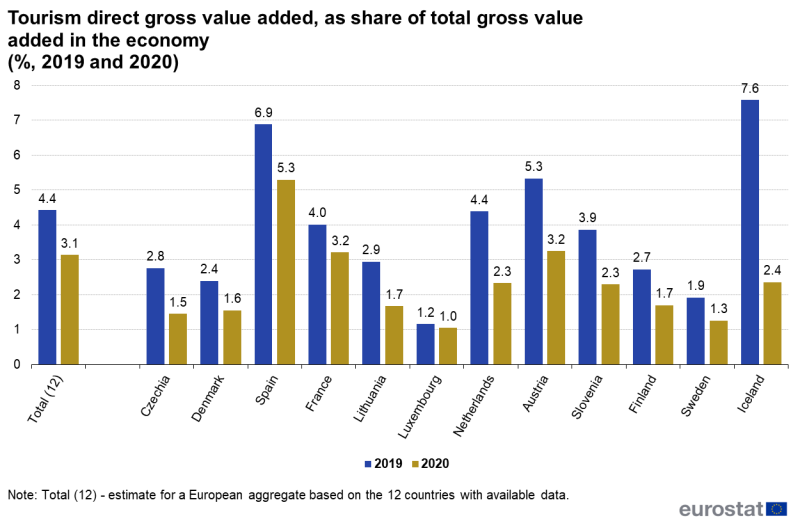
When considering the share of tourism direct gross value added in the economy’s total gross value added, a decrease by 1.3 percentage points was observed in the first year of the pandemic (see Figure 4): from 4.4 % in 2019 down to 3.1 % in 2020 (note that the 2019 figure is slightly different from the 4.5 % reported in the previous section, due to the subset of countries used in this analysis). Figure 4 shows the impact of the pandemic on the share of tourism direct gross value added for twelve countries for which data was available. Extending this analysis to the absolute values, tourism direct gross value added was estimated at €388 billion in 2020, a loss of €184 billion compared with the €572 billion estimated for 2019. Recalculated to a daily basis, this loss corresponded to over €500 million less tourism direct gross value added created on each day in 2020 on average.
According to national accounts, the EU economy lost €438 billion gross value added in 2020. This means that, with a loss of €184 million, the impact of the pandemic on the tourism sector played a very significant role (42 %) in the overall economic downturn.
Source data for tables and graphs
Data sources
The data used to compile this article comes from a voluntary submission of available TSA data by European countries. Every 3 years, Eurostat organises such voluntary submission, using a common template covering the headline figures for TSA. In the most recent exercise (2022), 27 countries participated, of which 23 were EU Member States. To reduce bias of the COVID-19 pandemic on the comparability of the data, it was suggested to countries to apply 2019 as a common reference year (some countries also provided data for 2020, allowing some insights in the impact of the pandemic). Not all countries provided all indicators included in the template.
To compile TSA at national level, countries use a wide range of different sources, the main ones include primary tourism statistics, business statistics supply and use tables and input-output tables.
More information on data sources for TSA, and on the coverage of the data collection, is available in Chapter 3, Annex I and Annex II of the Statistical Report Tourism Satellite Accounts in Europe | 2023 edition.
The reference methodology for TSA, is the internationally accepted 2008 Tourism Satellite Account: Recommended Methodological Framework (TSA:RMF 2008), that was jointly developed by the United Nations Statistics Division, Eurostat, the OECD and the UN Tourism.
Context
The EU is a major tourist destination, with 4 Member States among the world's top ten destinations for holidaymakers, according to UNWTO [1] data. Tourism is an important activity in the EU which contributes to employment and economic growth, as well as to the development of rural, peripheral or less-developed areas. These characteristics drive the demand for reliable and harmonised statistics on this activity, as well as within the wider context of regional policy and sustainable development policy areas.
Direct access to
Dedicated section
Methodology
<a class="ecl-link" href="https://ec.europa.eu/eurostat/documents/7894008/19439020/methodological-note-tourism-satellite-accounts.pdf/97a12938-9c20-de0b-a5f3-f5cd3f9db4b5?t=1718874211903">Methodological note</a>
