Services trade by enterprise characteristics - STEC
Data extracted in October 2023
Planned article update: January 2025
Highlights
Services Trade by Enterprise Characteristics (STEC) statistics provide information on the types of enterprises engaged in international trade in services and show how enterprises in different industries supply services and how this relates to their primary activity. This article presents services trade data broken down by enterprise size class, enterprise ownership and type of economic activity.
STEC data contribute to the larger statistical agenda on measuring economic globalisation and Global Value Chains (GVCs) and allow for better informed and tailored trade policies: by identifying the ownership status (foreign or domestic) of the enterprises involved in trade, the role of multinational enterprises in shaping globalization, and the relationship between trade and investment, is explicitly addressed. Moreover, STEC data provide an improved allocation of services exports and imports by type of industry of the trading enterprise; such data are needed for the development of the EU-inter country Supply, Use and Input-Output Tables (FIGARO project).
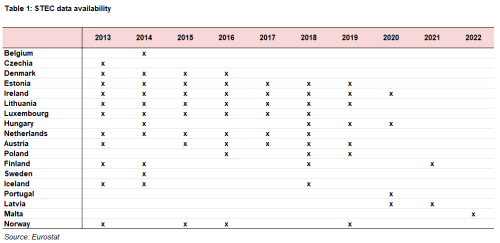
Several EU Member States and EFTA countries use microdata linking techniques to provide to Eurostat, on a voluntary basis, data on services trade by enterprise characteristics (STEC). Currently, STEC data are disseminated as “Experimental Statistics” on the Eurostat dedicated web section. Table 1 presents the data availability for the different countries.
The importance of the STEC statistics has been recognised and with the adoption of the European Business Statistics Regulation (EU) 2152/2019 STEC statistics become official statistics for the first time. The first reference year for STEC data reporting under the regulation is 2022. The methodology for the compilation of STEC statistics is described in the Eurostat-OECD Compilers Guide for Statistics on Services Trade by Enterprise Characteristics.
Since July 2022 Eurostat started disseminating the currently available voluntary STEC data. The published data include the following breakdowns:
- Services trade by enterprise characteristics (STEC) by NACE Rev.2 activities and enterprise size class – online data code [ext_stec01];
- Services trade by enterprise characteristics (STEC) by NACE Rev.2 activities and EBOPS 2010 items – online data code [ext_stec02] ;
- Services trade by enterprise characteristics (STEC) by NACE Rev.2 activities and type of ownership online data code [ext_stec03].
The analysis in this article is based on data from 18 countries for the period 2013-2021. Table 1 presents the data availability for the different countries.
Full article
General overview
This article analyses services trade by enterprise characteristics (STEC) data for 18 EU Member States and EFTA countries for the period 2013-2022. 2022 data are available for Malta; 2021 data are available for: Finland and Latvia and 2020 data have provided Ireland, Hungary and Portugal. The trading partner breakdown used for the analysis is ‘rest of the world’ (i.e. any other country). Due to the limited scope of the study, the conclusions are descriptive and cannot be generalised beyond the participating countries.
Increasingly, international trade in services is an important component and key driver of economic globalisation. Many services have become tradable due to digitalisation, such as health, education and business services. At the same time, many “new” services have been launched on international markets by means of information and communication technologies (ICT), digital trade, and digital platforms, leading to the creation of brand new markets. Taken together, STEC and trade in goods by enterprise characteristics (TEC) statistics provide a picture of the traders active on the international markets.
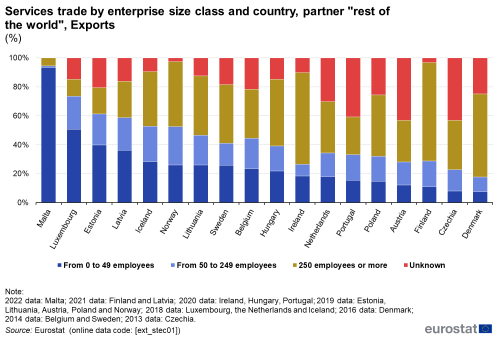
There are some clear differences between the countries covered by the data in terms of how the enterprises have responded to globalisation. As regards international trade in services, Luxembourg and Ireland are more open to international markets than the other countries: typically, foreign owned affiliates enjoy a strong position in their markets and account for the biggest part of the exported services (Ireland 84% and Luxembourg 78%). In contrast, domestic service providers have a strong position in Lithuania, Finland, Denmark, Iceland and Norway accounting for more than 54% of the services exports. STEC data allow to look at the size of the enterprises involved in services trade. For example, small enterprises (up to 49 employees) are responsible for 93% of the services exports from Malta and for only 7% in Denmark. The reason for the high proportion in Malta is the substantial contribution to exports and imports of companies operating in the NACE category 64 (Financial service activities, except insurance and pension funding) and NACE 92 (Gambling and betting activities) and the fact that services provided from these companies do not require a large amount of human involvement. As a general tendency is observed that the small enterprises tend to be domestically controlled, while large enterprises are more likely to be foreign controlled.
Trade in services by enterprise size
Small and medium enterprises account for 93% of the exports of services trade in Malta and only 18% in Denmark.
Data on enterprise size class help determine whether trade in services is dominated by small (up to 49 employees), medium (50-249 employees) or large enterprises (250 or more employees). The analysis shows (Figure 1) that the smaller enterprises are dominant in small countries (Malta, Luxembourg, Estonia and Iceland). The smaller enterprises (less than 250 employees) were responsible for the biggest proportion of services exports in Malta (95%), Luxembourg (73%), Estonia (61%), Latvia (59%), Iceland (53%), Norway (52%), Lithuania (47%) and Belgium (44%). They made a much smaller contribution in economies such as Ireland (26%), Czechia (23%) and Denmark (18%). In some countries, large enterprises (which tend to be foreign controlled) have a dominant role, e.g. they accounted for over half of the services exported from Finland (68%), Ireland (63%) and Denmark (57%).
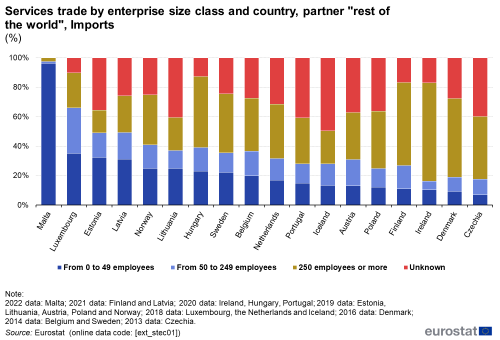
The pattern of imports of services shares similarities with the former one of exports. In Ireland (67%), Finland (56%) and Denmark (53%), large enterprises are responsible for at least half of services imports (Figure 2). Smaller enterprises were responsible for the biggest proportion of imports in Malta (97%), Luxembourg (66%), Latvia and Estonia (49%), and Norway (41%).
Trade in services by enterprise ownership
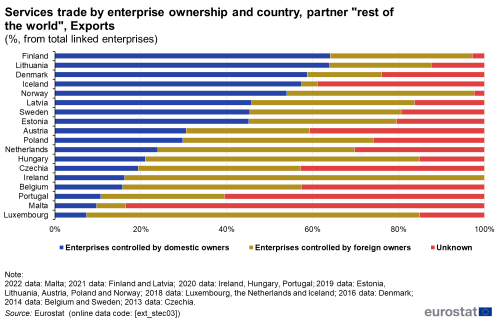
Foreign controlled enterprises are predominant in Ireland and Luxembourg: they are responsible for 84% of services exports and 89% of the imports from Ireland; and 78% of Luxembourgish exports and imports.
The type of ownership indicates whether an enterprise is domestically or foreign controlled. A high proportion of foreign controlled services traders is an indication that the economy in question is well integrated in international markets and global value chains. Typically, this is reflected by foreign affiliates enjoying a strong position in trade in services. Domestically controlled enterprises account for more than half of services exports from Finland and Lithuania (64%), Denmark (59%), Iceland (57%) and Norway (54%). Foreign controlled enterprises are responsible for most services exports from Ireland (84%), Luxembourg (78%), Hungary (64%) and the Netherlands (46%) (Figure 3).
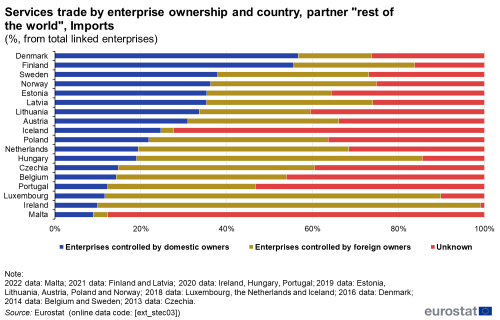
The relative contributions of domestically and foreign-controlled enterprises also vary in relation to services imports (Figure 4). The domestically controlled enterprises are responsible for just 9% of the services imports in Malta, 10% in Ireland and 12% in Luxembourg. The highest proportion of services imports by domestically controlled enterprises is in Denmark (57%), followed by Finland (56%). In Ireland 89% and in Luxembourg 78% of the imports are due to the activities of the foreign-controlled enterprises. The lowest proportion of services imports by foreign-controlled enterprises is in Denmark (17%), and Iceland and Malta (3%).
Trade in services by enterprises’ economic activity
The economic activities of the traders varies a lot among the countries
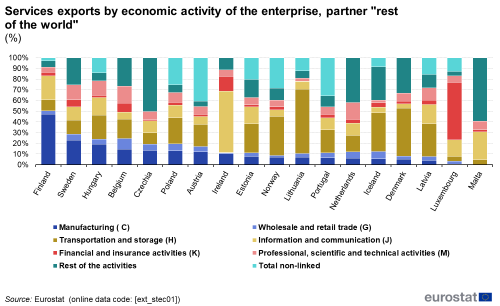
The economic activity of a trading enterprise indicates their main field of operation. Enterprises in some activities (e.g. manufacturing) export mainly goods, while others (such those with a main activity in NACE Sections H-N) are mostly involved in services. Figure 5 shows the proportions of services exports attributable to enterprises in different activities, as defined by their main economic activity. In Finland 47% of the services exports come from the Manufacturing sector. The share of services exports in the Wholesale and retail trade activities is relatively low for all 18 countries, being the highest for Belgium (10%). Transport and storage enterprises are responsible for 60% of the services exports from Lithuania and 45% from Denmark. Only 4% of the Luxembourgish and Maltese exports come from enterprises in the Transport and storage sector. Traders in the information and communication sector were responsible for about 57% of the services exports from Ireland. On the other end stays Denmark with only 4% exports from this economic activity. In Luxembourg about 53 % of the exported services are in the sector of Financial and insurance activities, for Ireland the value is 14%, for Belgium 9%, Sweden 7% and 4% or less for the rest of the countries (note that data on this sector are missing for Lithuanian services exports). The sector of Professional, scientific and technical activities contributes for 16% of the exports of the enterprises in the Netherlands and Belgium.
Feedback
To help Eurostat improve these experimental statistics, users and researchers are kindly invited to give us their feedback by email
Source data for tables and graphs
Data sources
The development of STEC statistics represents a major step forward in integrating services trade data into business statistics. STEC statistics make the link between the volume of trade in services and the characteristics of the enterprises involved. They provide information on specific characteristics of enterprises: enterprise size class, the economic activity in which they operate and their ownership (domestic or foreign-controlled). STEC data are produced by combining statistical business register information with data on international trade in services at enterprise level. This allows to link data on the value of each enterprise’s exports and imports to its characteristics, as provided in the business register. The resulting dataset provides a breakdown of the trader population according to size of the enterprise (small, medium and large), type of ownership and category of main economic activity. Linking different datasets adds value to data, without increasing the collection burden on enterprises and has limited costs to data compilers.
Context
STEC statistics provide users with indicators on traders operating in the international market of services. They disclose additional insights into trade statistics, by allowing the profiling of the enterprises according to selected characteristics such as number of employees, type of ownership and economic activity. The increasing importance of international trade in services — accelerated by digitalisation and the development of new services — has led to a growing demand for STEC data. International trade in services statistics offer a picture of services flows between countries, broken down by type of service. While this constitutes important input for trade analyses, such data do not tell us anything about the enterprises that actually trade in services. The profiling of traders is crucial if we are to gain an understanding of the incentives and consequences of services trade at micro (enterprise) level to complement the big picture provided by traditional services trade statistics. The importance of these statistics has been recognised and introduced as a regular data reporting for the EU and EFTA countries with the European Business Statistics Regulation (Regulation 2152/2019). The first reference period for data reporting is 2022. The first official data transmission will take place in June 2024 and the first official STEC dataset worldwide will be published by the end of 2024.
Direct access to
