_Palette_A_pie_chart_2_decimals.png)
 Palette A pie chart 2 decimals.png&body=Statistics Explained - Table 1 Distribution according to the frequency of alcohol consumption, 2019 (%) Palette A pie chart 2 decimals.png %0A https%3A%2F%2Fec.europa.eu%2Feurostat%2Fstatistics-explained%2Findex.php%3Ftitle%3DFile%3ATable_1_Distribution_according_to_the_frequency_of_alcohol_consumption%2C_2019_%28%2525%29_Palette_A_pie_chart_2_decimals.png)
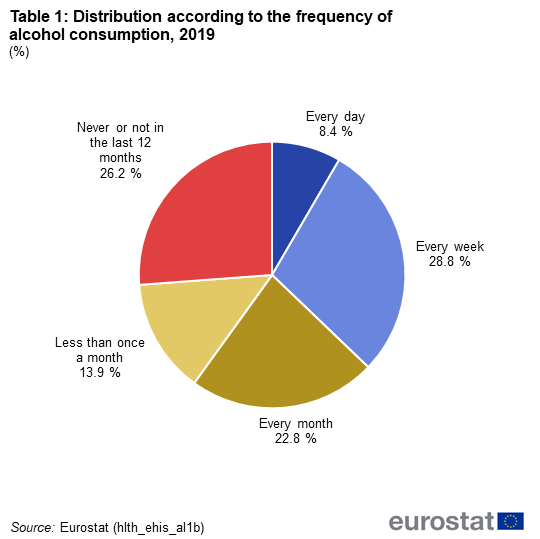
File:Table 1 Distribution according to the frequency of alcohol consumption, 2019 (%) Palette A pie chart 2 decimals.png
No higher resolution available.
Table_1_Distribution_according_to_the_frequency_of_alcohol_consumption,_2019_(%)_Palette_A_pie_chart_2_decimals.png (540 × 539 pixels, file size: 32 KB, MIME type: image/png)
null
File usage
The following page uses this file:
_Palette_A_pie_chart_2_decimals.png&oldid=606117)
_Palette_A_pie_chart_2_decimals.png)
_Palette_A_pie_chart_2_decimals.png&action=edit&redlink=1)
_Palette_A_pie_chart_2_decimals.png&action=history)