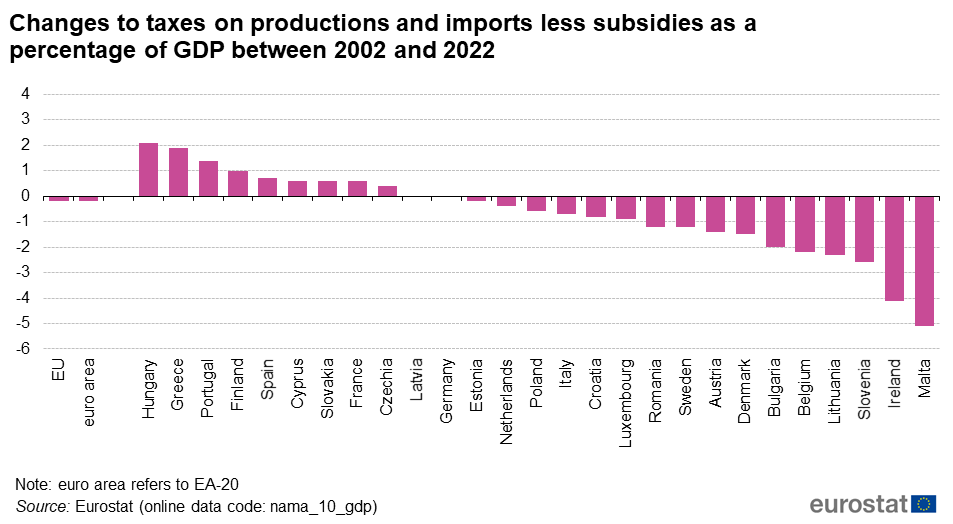
File:Fig6 Changes to taxes on productions and imports less subsidies as a percentage of GDP between 2002 and 2022.png
Revision as of 12:32, 5 April 2023 by Tsigkor (talk | contribs) (Tsigkor uploaded a new version of File:Fig6 Changes to taxes on productions and imports less subsidies as a percentage of GDP between 2002 and 2022.png)
Size of this preview: 800 × 440 pixels. Other resolutions: 320 × 176 pixels | 953 × 524 pixels.
Original file (953 × 524 pixels, file size: 46 KB, MIME type: image/png)
File usage
There are no pages that use this file.