Archive:Electricity generation statistics – first results
- Data from Month Year, most recent data: Further Eurostat information, Main tables and Database.
Main statistical findings
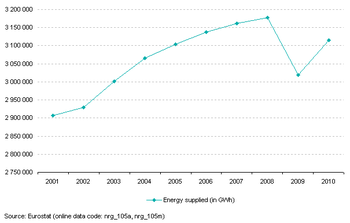
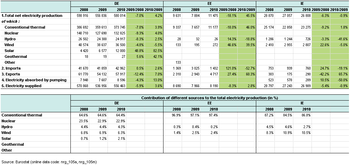
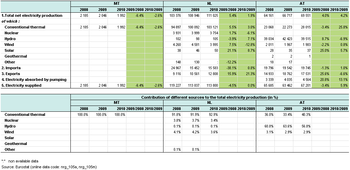
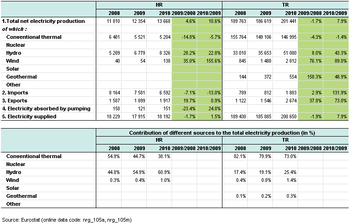
This article takes a look at most recent statistics (provisional 2010 figures) on the volumes of electricity that have been produced and supplied at EU-27 level, at Eurozone level and at the EU-27 Member States plus Norway, Croatia and Turkey. As illustrated in figure 1, the supply of electricity in EU27 increased with 3.2% in 2010 compared to 2009, but it is still below the production from 2008.
Production of electricity
After the significant decrease of electricity production in 2009 (-4.9%), caused by the economical crisis, the volume of produced electricity increased at EU-27 level in 2010 with 3.6% compared to the preceding year.
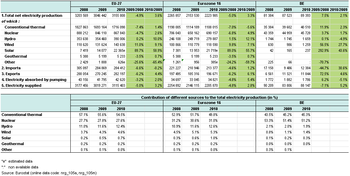
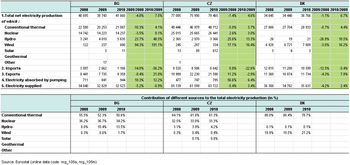
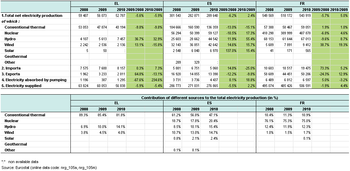
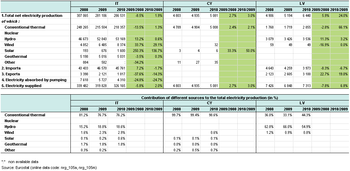
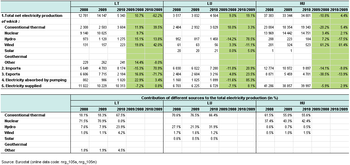
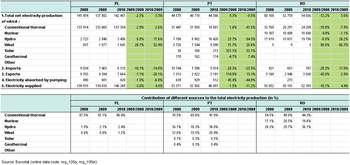
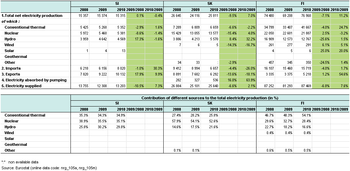
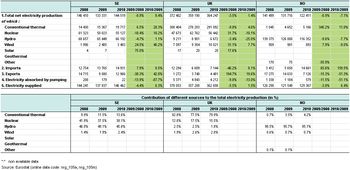
Tables 1 to 10 show the production and supply figures for EU-27, Eurozone, all EU Member States, Norway, Croatia and Turkey.
Estonia (+45.5%), Latvia (+24%), Luxembourg (+19.1%), Finland (+11.2%) and Sweden (+8.4%) are the Member States that recorded the largest increases in electricity generation. Estonia and Latvia exported increased volumes of electricity to Lithuania that closed a Nuclear Power Station in 2010.
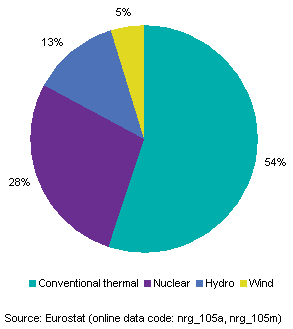
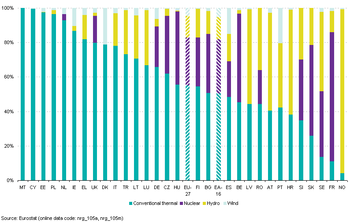
As regards the structure of generation in 2010 (figure 2):
- The generation of conventional thermal energy increased by 1.4% in the EU-27 and accounted for 54.5% of total generation;
- The generation of nuclear energy also increased in the EU-27 (+2.6%) and accounted for 27.6% of the total;
- The generation of hydro and wind increased in the EU-27 by 10% and 9.1% respectively and represented 12.4% and 4.6% of the total;
- The generation of solar energy increased by 58.9% in the EU-27 and represented 0.7% of the total.
Norway recorded a decrease in total generation (-7.1%), in Turkey and Croatia, generation increased in 2010 by 7.9% and 10.6% respectively.
Electricity supplied to the market
The volume of electricity that is supplied to the market is defined as the total net volume of electricity generated minus the exports plus the imports minus the electricity that is absorbed by pumping.
As illustrated in figure 1, the supply of electricity in EU27 increased with 3.2% in 2010 compared to 2009, but it is still below the level at 2008.
In 2010, the EU-27 was a net importer of electricity with 2215 GWh or 0.07% of the total generation, compared to 0.5% (14724 GWh) in 2009.
When looking at national level, the largest increases could be observed in Luxembourg (+8.1%), Finland (+7.6%), and Slovenia (+7.3%). Supply of electricity increased in the 5 largest EU Member States, France (+4.4%), Germany (+3.6%), Spain (+2.2%), Italy (+2.0%) and in the UK (+1.5%). In Turkey, the supply increased with 7.9% compared to 2009.
Decreases in supply figures were observed in Portugal (-11.2%), Greece (-5.4%), Malta (-2.6%) and Ireland and Bulgaria (both -0.9%).
Data sources and availability
<description of data sources, survey and data availability (completeness, recency) and limitations>
Context
<context of data collection and statistical results: policy background, uses of data, …>
Further Eurostat information
Publications
Main tables
- Title(s) of second level folder (if any)
- Title(s) of third level folder (if any)
Database
- Title(s) of second level folder (if any)
- Title(s) of third level folder (if any)
Dedicated section
Methodology / Metadata
<link to ESMS file, methodological publications, survey manuals, etc.>
- Name of the destination ESMS metadata file (ESMS metadata file - ESMS code, e.g. bop_fats_esms)
- Title of the publication
Source data for tables, figures and maps on this page (MS Excel)
Other information
<Regulations and other legal texts, communications from the Commission, administrative notes, Policy documents, …>
- Regulation 1737/2005 of DD Month YYYY on ...
- Council Directive 86/2003 of DD Month YYYY
- Commission Decision 86/2003 of DD Month YYYY
<For other documents such as Commission Proposals or Reports, see EUR-Lex search by natural number>
<For linking to database table, otherwise remove: {{{title}}} ({{{code}}})>
