.png)
.png&body=Statistics Explained - Figure 8 Share of the population who perceived there was crime, violence or vandalism in the area where they live, 2010 and 2020 (% of total population).png %0A https%3A%2F%2Fec.europa.eu%2Feurostat%2Fstatistics-explained%2Findex.php%3Ftitle%3DFile%3AFigure_8_Share_of_the_population_who_perceived_there_was_crime%2C_violence_or_vandalism_in_the_area_where_they_live%2C_2010_and_2020_%28%2525_of_total_population%29.png)
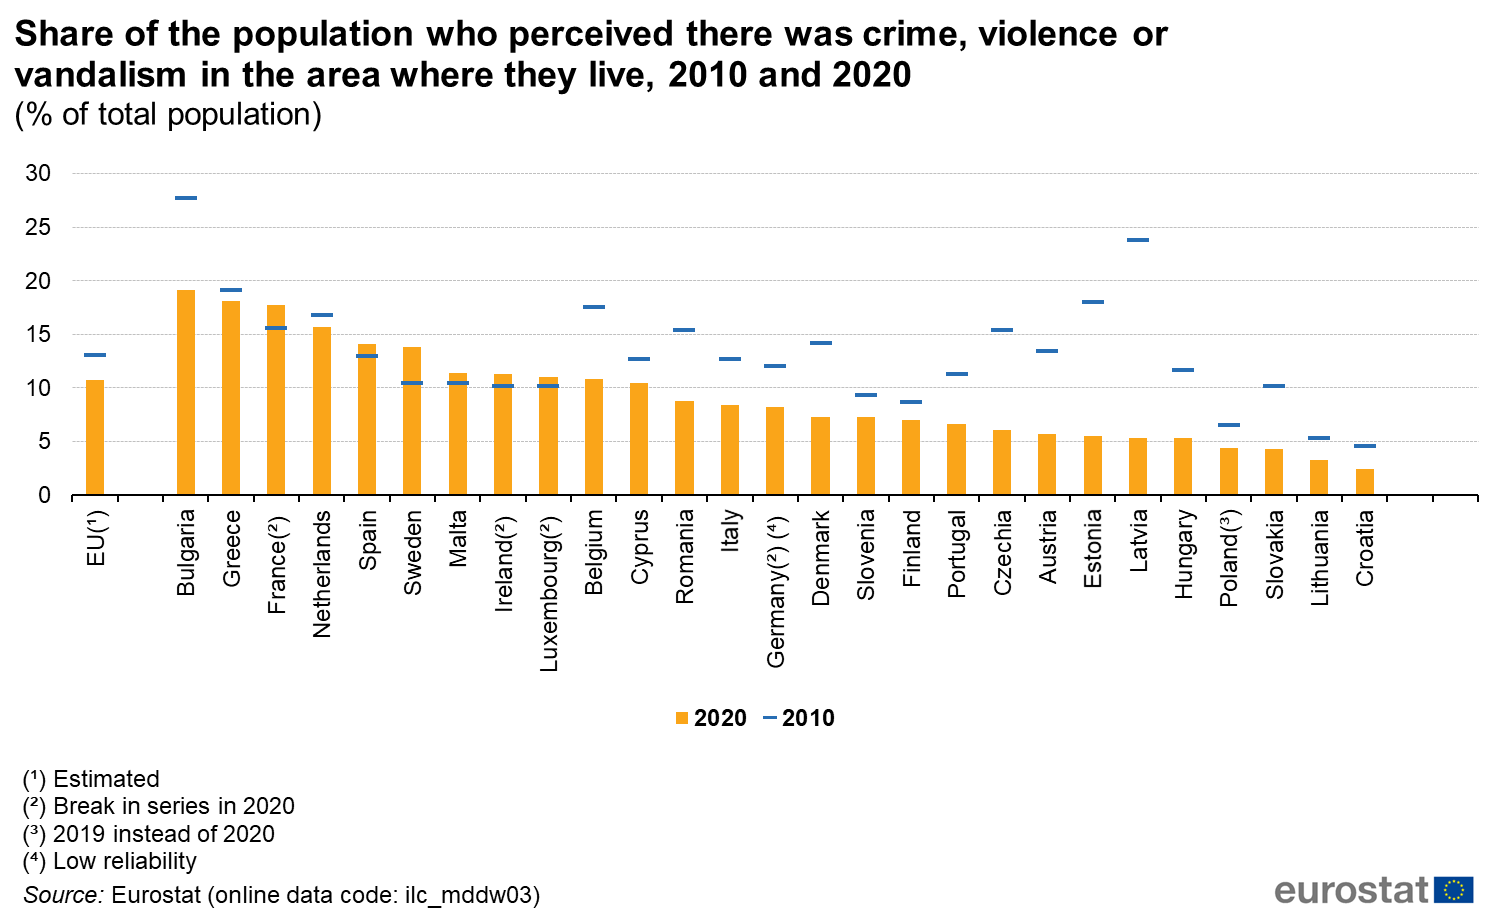
File:Figure 8 Share of the population who perceived there was crime, violence or vandalism in the area where they live, 2010 and 2020 (% of total population).png
Size of this preview: 800 × 490 pixels. Other resolutions: 320 × 196 pixels | 1,500 × 918 pixels.
Original file (1,500 × 918 pixels, file size: 107 KB, MIME type: image/png)
null
File usage
The following page uses this file:
.png&oldid=591858)
.png)
.png&action=edit&redlink=1)
.png&action=history)