TestPDF
Data extracted in October 2022
Planned article update: January 2023
Highlights
First EU-wide monitoring of food waste: 127 kg per inhabitant in the EU in 2020
This article provides the results of the first dedicated statistical monitoring of the amount of food waste in the European Union by sector of activity according to the NACE rev. 2 classification and by households, excluding food losses (food not harvested or food not authorised to be marketed for safety reasons), for the year 2020.
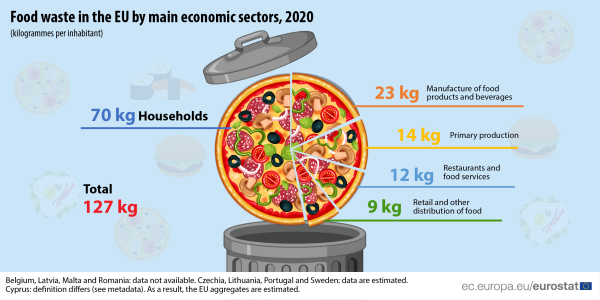
In 2020, the first year of the COVID-19 pandemic, around 127 kilogrammes (kg) of food waste per inhabitant were generated in the EU. Households generated 55 % of food waste, accounting for 70 kg per inhabitant. The remaining 45 % was waste generated upwards in the food supply chain. Household food waste is nearly twice the amount of food waste arising from the sectors of primary production and manufacture of food products and beverages (14 kg and 23 kg per inhabitant; 11 % and 18 %, respectively), sectors in which strategies exist for reducing food waste, for instance with the use of discarded parts as by-products. Restaurants and food services accounted for 12 kg of food waste per person (9 %), while retail and other distribution of food was the sector with the least amount of food waste (9 kg; 7 %); however, the impact of the COVID-19 lockdowns on these two sectors is still being analysed.
Full article
Amounts of food waste at EU level
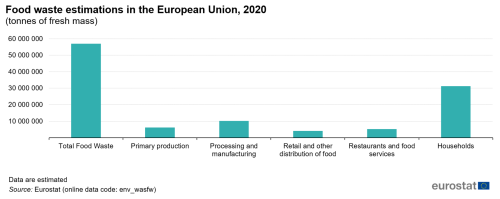
At EU level, the total food waste measured in 2020 nearly reached 57 million tonnes of fresh mass. Household food waste represented more than 31 million tonnes of fresh mass, with a 55 % share of the total. The second sector in terms of share (18 %) was processing and manufacturing, where the amount of measured food waste was slightly above 10 million tonnes of fresh mass. The remaining share, a quarter of the total food waste, was from primary production sector (6 million tonnes, 11 % share towards the total amount of food waste), restaurants and food services (more than 5 million tonnes, 9 % share towards the total) and retail and other distribution of food sectors (more than 4 million tonnes , 7 % share). These amounts are presented in Figure 1.
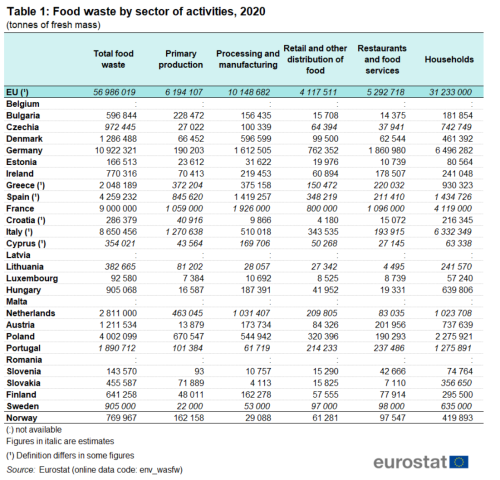
Table 1 presents the amounts of food waste declared by the countries for reference year 2020, measured in tonnes of fresh mass, by sector of activities.
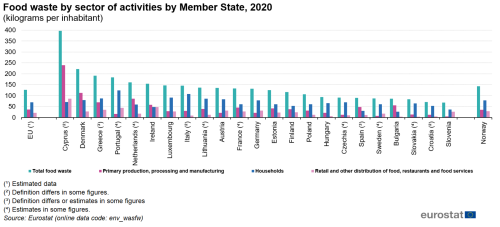
Figure 2 summarises, by aggregated sectors, food waste in terms of kilograms per inhabitant; as compared with Figure 1 and Table 1, Figure 2 also presents data from the sectors primary production and processing and manufacturing aggregated in a single class; data from sectors retail and other distribution of food and restaurants and food services are also aggregated in a single class. Figure 2 displays, therefore, for each country, the five sectors collapsed into three sectors, presented side by side with the total food waste, all in kilograms per inhabitant.

Source: Eurostat (env_wasfw), definitions
In the supply and consumption sectors, food waste generation may represent 10 percent of food supplied in the EU
Table 2 illustrates that generated food waste may count for 10 % of food supplied to EU consumers in the supply and consumption sectors ("Retail and other distribution of food", "Restaurants and food services" and "Households"). To arrive at this assumption, Eurostat has roughly estimated the food placed on the market from the 2019 FAO data on food supply quantity (source: Food Balances Sheet, FAO database) provided in kilograms per inhabitant, and compared it with food waste amounts in the supply and consumption sectors.

Source: Eurostat (env_wasfw) and FAO (Food Balances Sheet)
Direct access to


