.png)
.png&body=Statistics Explained - Share of utility vehicles in total number of vehicles, the 15 regions with the highest shares, NUTS 2 regions, 2020 (%).png %0A https%3A%2F%2Fec.europa.eu%2Feurostat%2Fstatistics-explained%2Findex.php%3Ftitle%3DFile%3AShare_of_utility_vehicles_in_total_number_of_vehicles%2C_the_15_regions_with_the_highest_shares%2C_NUTS_2_regions%2C_2020_%28%2525%29.png)
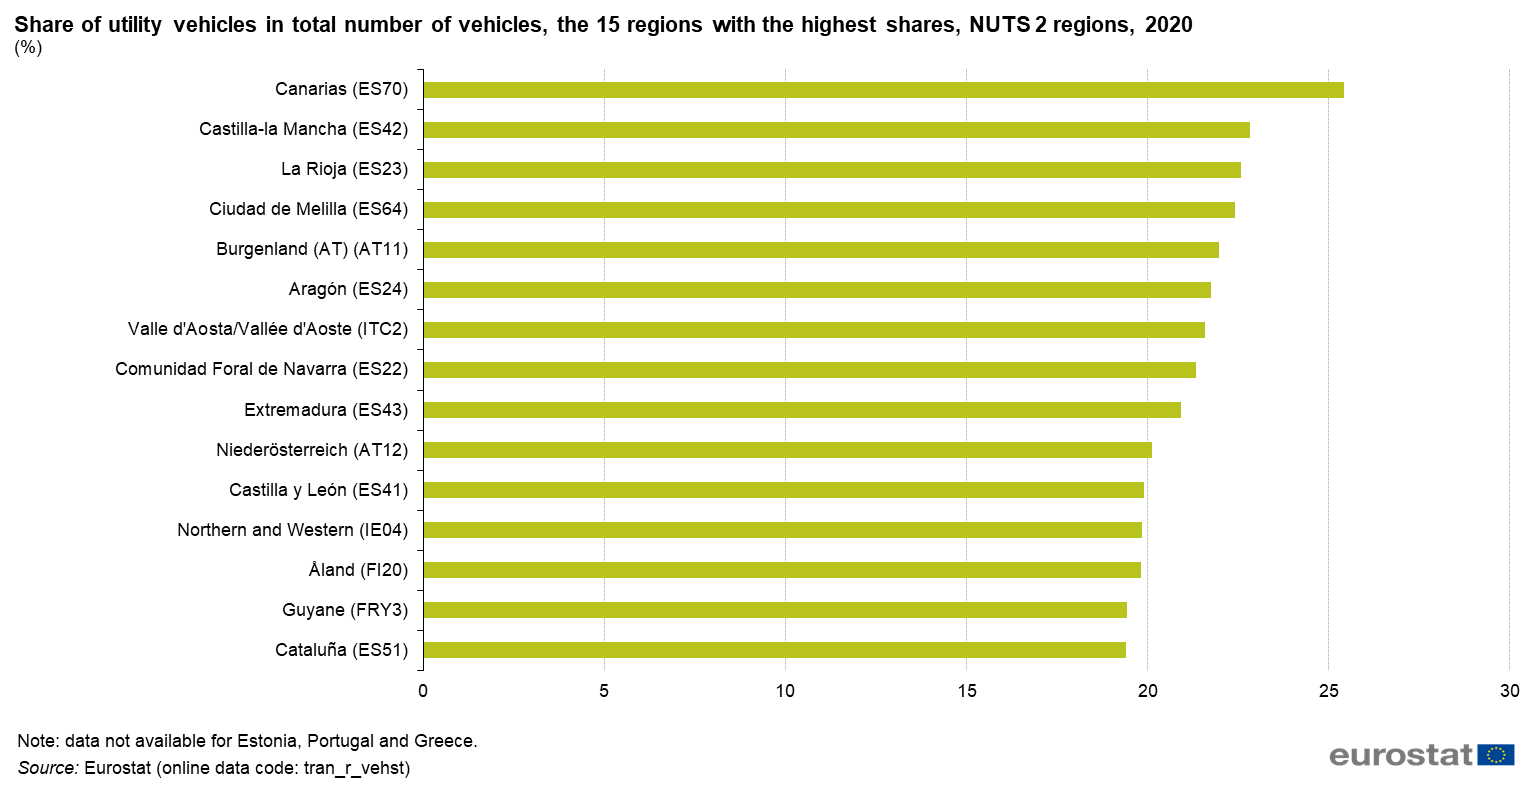
File:Share of utility vehicles in total number of vehicles, the 15 regions with the highest shares, NUTS 2 regions, 2020 (%).png
Size of this preview: 800 × 409 pixels. Other resolutions: 320 × 164 pixels | 1,539 × 787 pixels.
Original file (1,539 × 787 pixels, file size: 53 KB, MIME type: image/png)
File usage
There are no pages that use this file.
.png&oldid=573247)
.png)
.png&action=edit&redlink=1)
.png&action=history)