,_EU,_1960-2021_(per_1_000_persons).png)
, EU, 1960-2021 (per 1 000 persons).png&body=Statistics Explained - Fig03 Population change by component (annual crude rates), EU, 1960-2021 (per 1 000 persons).png %0A https%3A%2F%2Fec.europa.eu%2Feurostat%2Fstatistics-explained%2Findex.php%3Ftitle%3DFile%3AFig03_Population_change_by_component_%28annual_crude_rates%29%2C_EU%2C_1960-2021_%28per_1_000_persons%29.png)
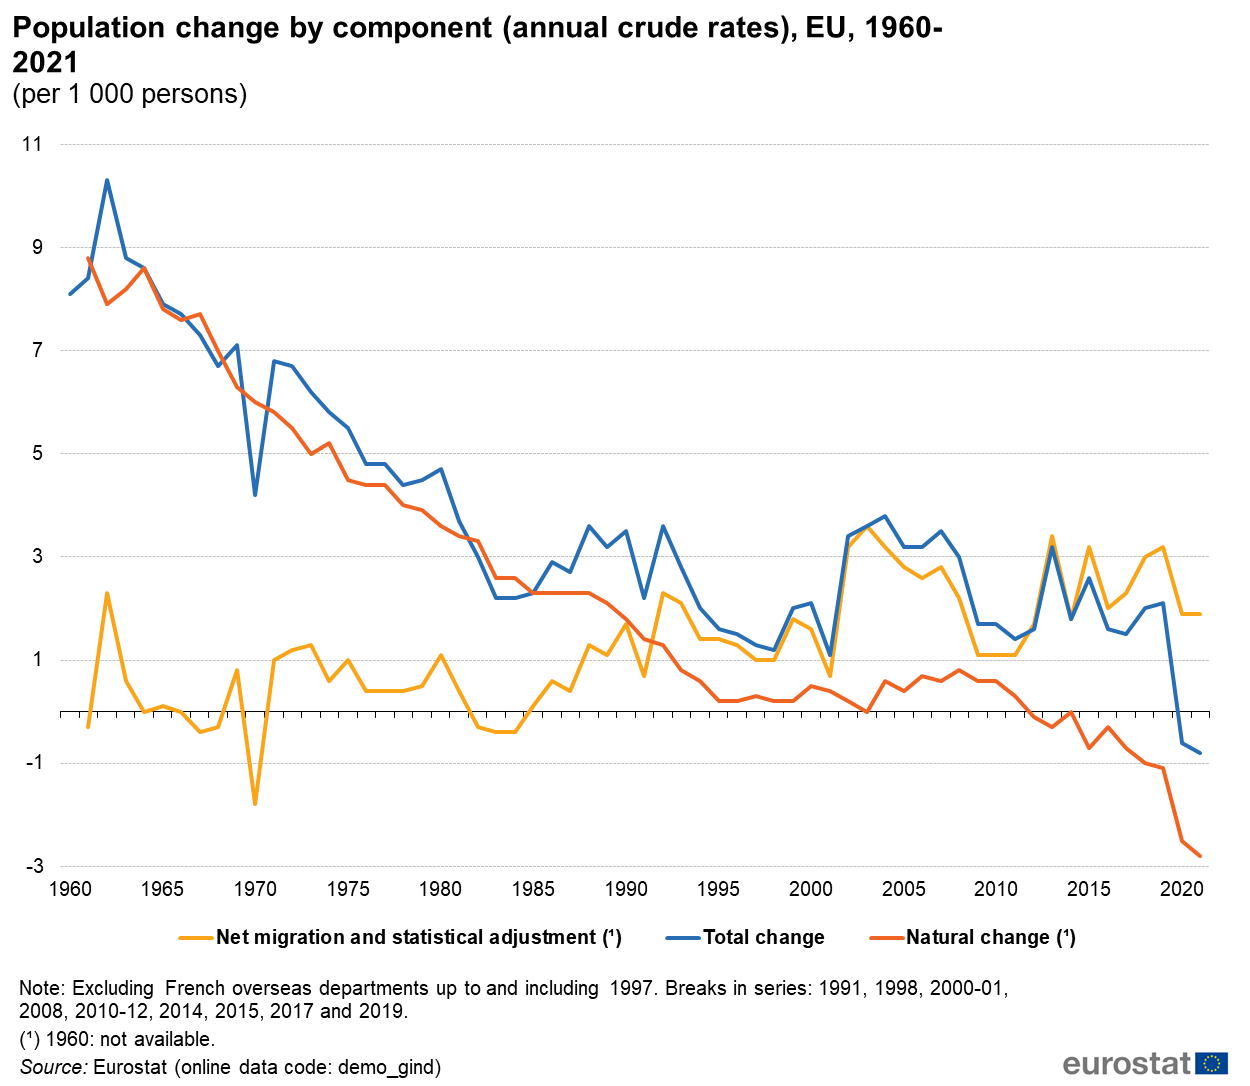
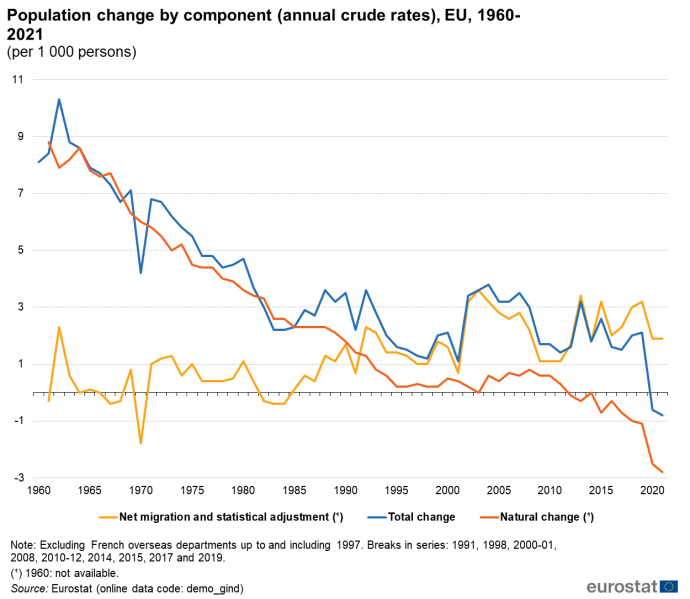
File:Fig03 Population change by component (annual crude rates), EU, 1960-2021 (per 1 000 persons).png
Size of this preview: 690 × 599 pixels. Other resolutions: 276 × 240 pixels | 1,250 × 1,086 pixels.
Original file (1,250 × 1,086 pixels, file size: 112 KB, MIME type: image/png)
File usage
There are no pages that use this file.
,_EU,_1960-2021_(per_1_000_persons).png&oldid=571797)
,_EU,_1960-2021_(per_1_000_persons).png)
,_EU,_1960-2021_(per_1_000_persons).png&action=edit&redlink=1)
,_EU,_1960-2021_(per_1_000_persons).png&action=history)