.png)
.png&body=Statistics Explained - Figure 2 - HICP for selected sports goods and services, EU, average rates of change (%, AAGR 2017-2021 and annual 2020-2021).png %0A https%3A%2F%2Fec.europa.eu%2Feurostat%2Fstatistics-explained%2Findex.php%3Ftitle%3DFile%3AFigure_2_-_HICP_for_selected_sports_goods_and_services%2C_EU%2C_average_rates_of_change_%28%2525%2C_AAGR_2017-2021_and_annual_2020-2021%29.png)
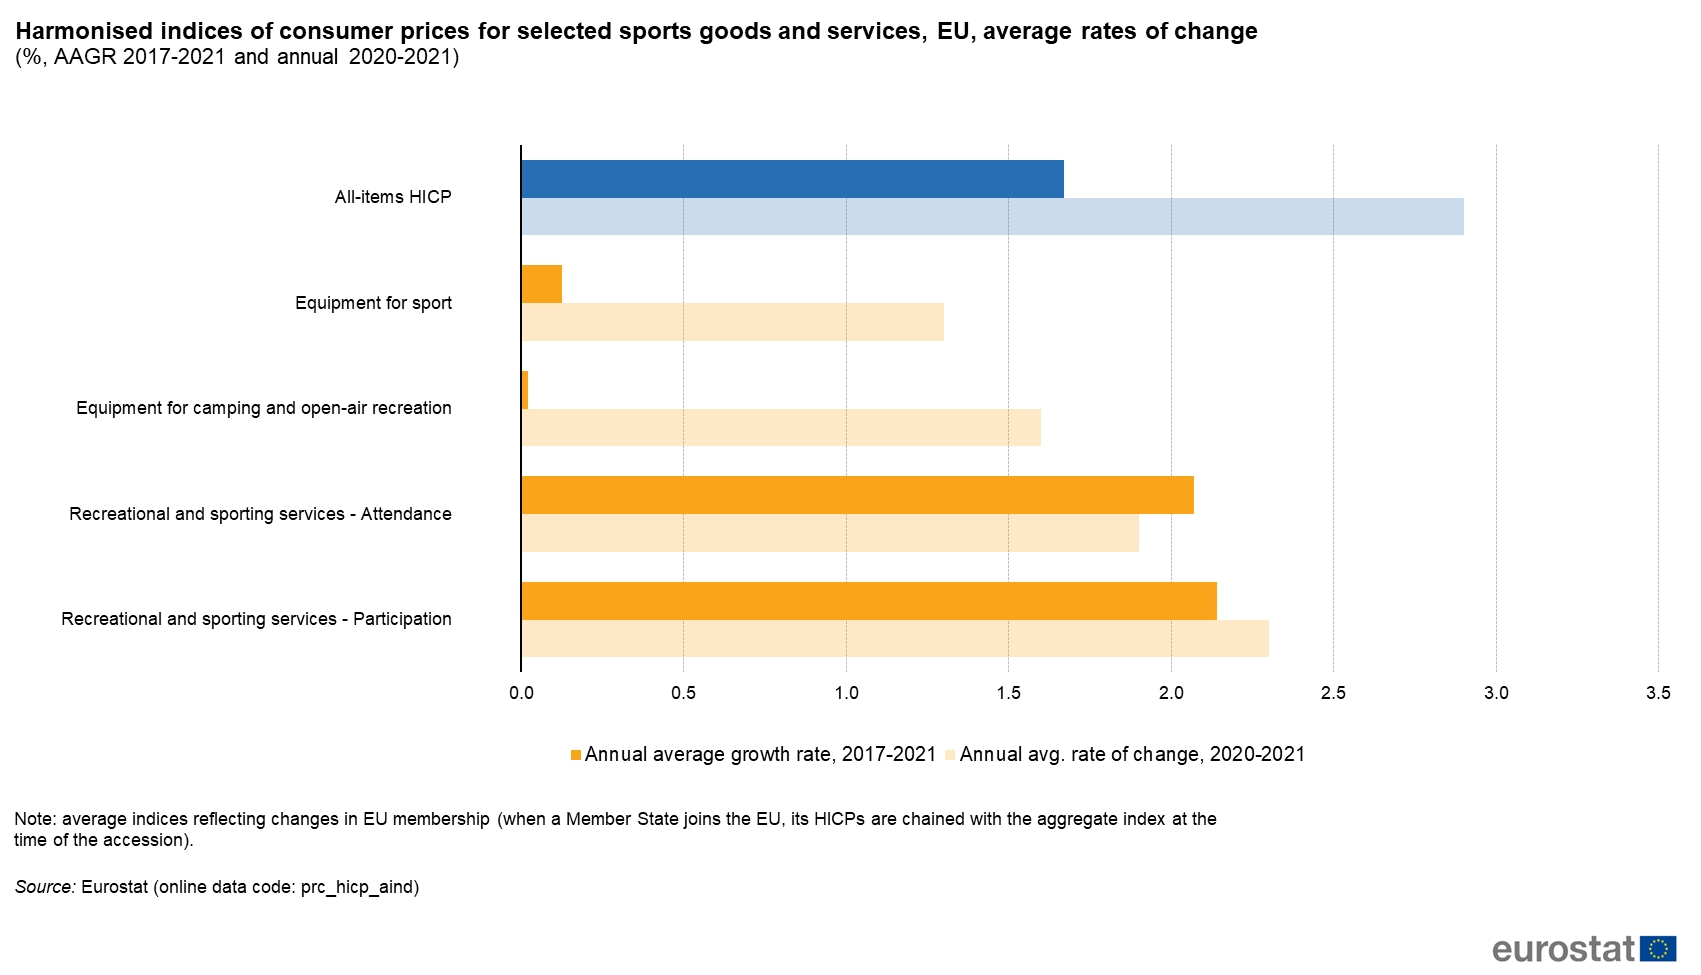
File:Figure 2 - HICP for selected sports goods and services, EU, average rates of change (%, AAGR 2017-2021 and annual 2020-2021).png
Size of this preview: 800 × 459 pixels. Other resolutions: 320 × 183 pixels | 1,701 × 975 pixels.
Original file (1,701 × 975 pixels, file size: 76 KB, MIME type: image/png)
File usage
There are no pages that use this file.
.png&oldid=569050)
.png)
.png&action=edit&redlink=1)
.png&action=history)