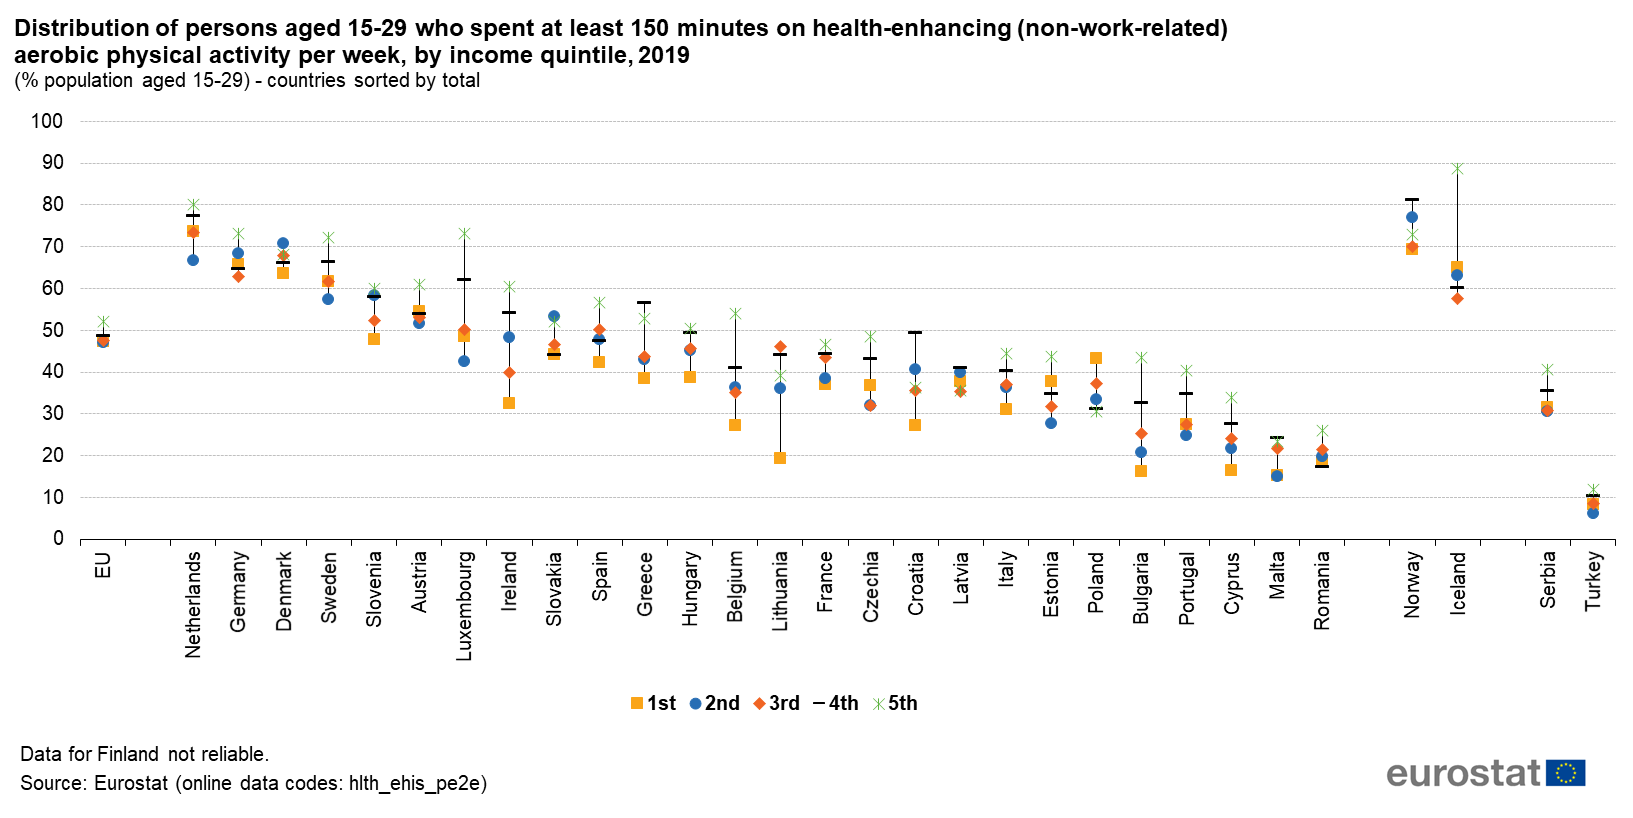
File:Figure 6 Distribution of 15-29 persons who spent at least 150 minutes on physical activity per week, by income quintile, 2019.png
Size of this preview: 800 × 401 pixels. Other resolutions: 320 × 160 pixels | 1,633 × 818 pixels.
Original file (1,633 × 818 pixels, file size: 105 KB, MIME type: image/png)
File usage
The following page uses this file: